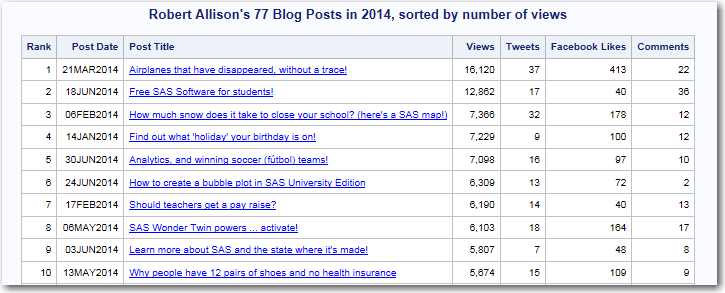
As a blogger, I often wonder whether my blog posts are 'successful' - and being a graph guy, I like to visually analyze the data, to try to answer that question. The most common measure of a blog post is probably the number of times it was viewed, so I guess
Author
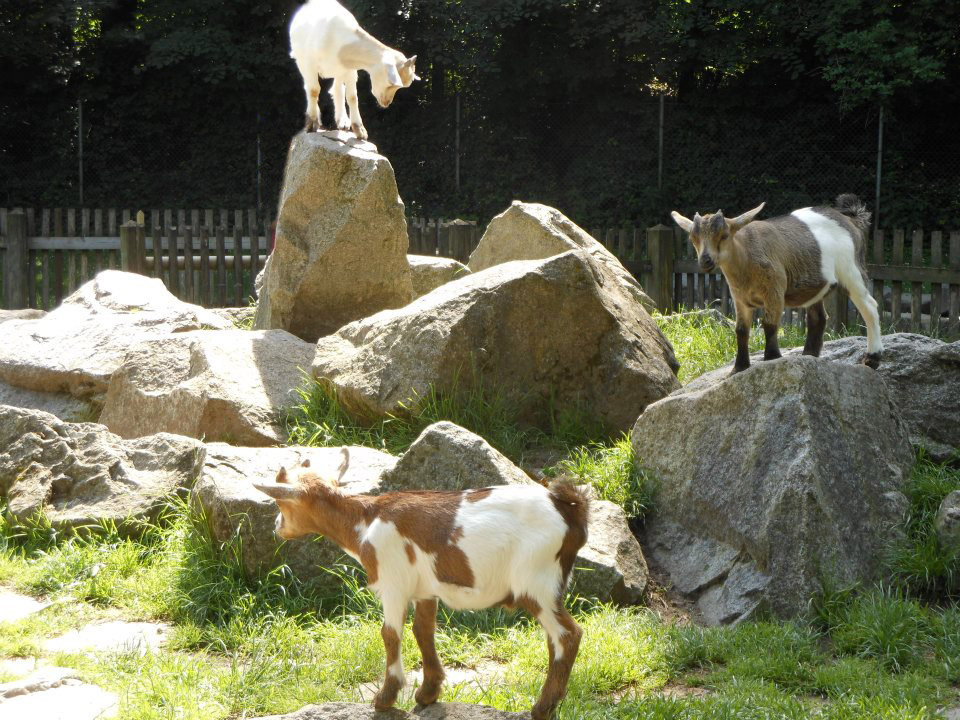
Is this blog post about techniques to use on difficult graph legends, or is it about goats? The answer is both! But first, to get you into the proper mood, here is a picture my friend, Mark, took of some cute goats. And some links to YouTube videos about goats
I recently read an article that listed the 100 best restaurants in the US - but the article didn't have a map. I decided to use my SAS skills to change that! When it comes to restaurants, I eat out a lot (and by 'a lot' I mean I never
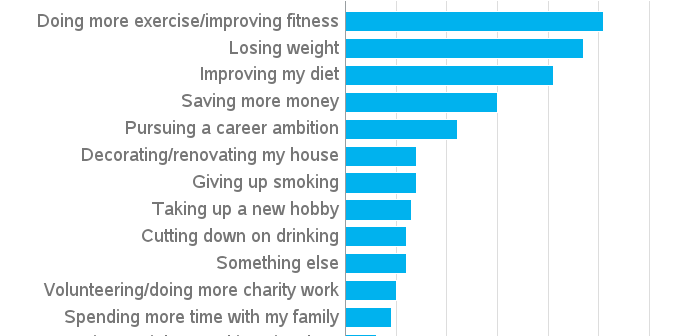
Can you guess the 5 most common New Year's resolutions? Compare your guesses to the survey results!... Being a data meister, I'm always on the lookout for seasonal data. I recently did a Web search for "new year's resolutions" and found an interesting article on the You Gov UK website.
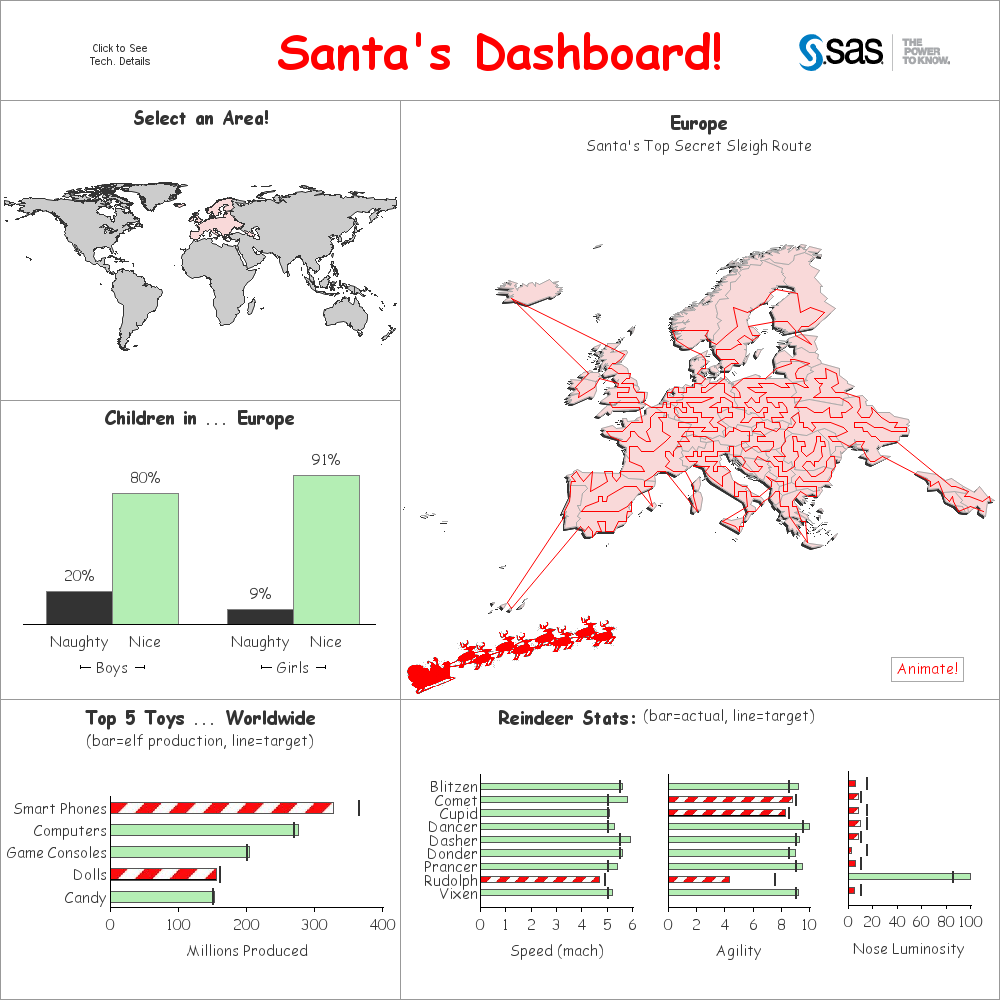
How does Santa keep track of everything on his big night? I can't confirm or deny that he uses SAS software -- but if he does, it would look a lot like this! ... A couple of years ago, I blogged about a prototype dashboard that I wrote for Santa. This
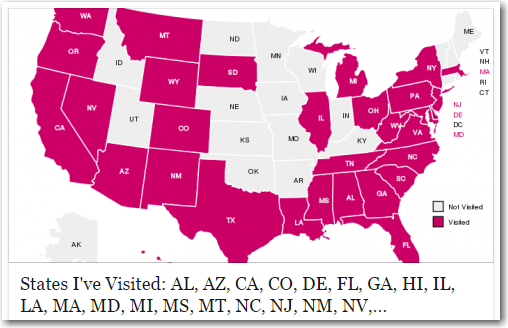
There's recently been a "States I've Visited" application going around on Facebook, where users create a map showing all the US states they've visited, and then post it on their page for their friends to see. I wondered if SAS could do a better job?... Here's a screen-capture of one
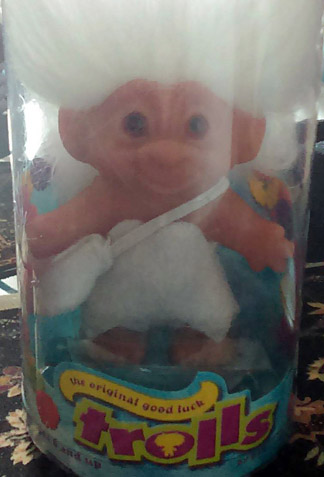
Are you a legitimate hard-working company that has been threatened with a lawsuit, by a patent troll? If so, the graphs in this blog should make you happy! Speaking of 'happy' and 'troll' - here's a picture of a happy Troll Doll from my friend Hannah. Don't you just hate
In sports these days, there's a lot more data to keep track of than just the score! How can you make sense of it all? Being the Graph Guy, of course I recommend graphing it! Here's an example that's up close and personal for me - dragon boat racing... Below
SAS software has long been used to help analyze 'risk' - what about using it to help determine your risk of being attacked by a vampire?!? On a previous Halloween, I was the victim of a Vampire attack. Here's the photographic proof... Being the most common O+ blood type, I
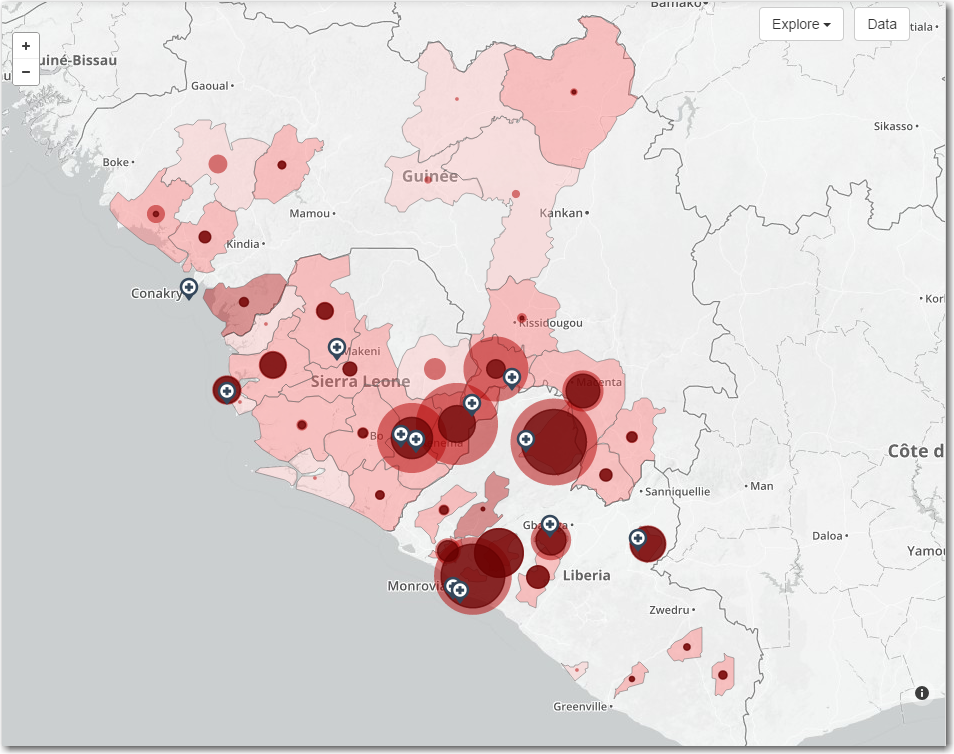
In a previous blog post, I showed how to layer colored areas on a SAS map to show both countries, and the areas within countries that had cases of Ebola. But as the Ebola epidemic has spread, more data has become available, and in this blog I show how to