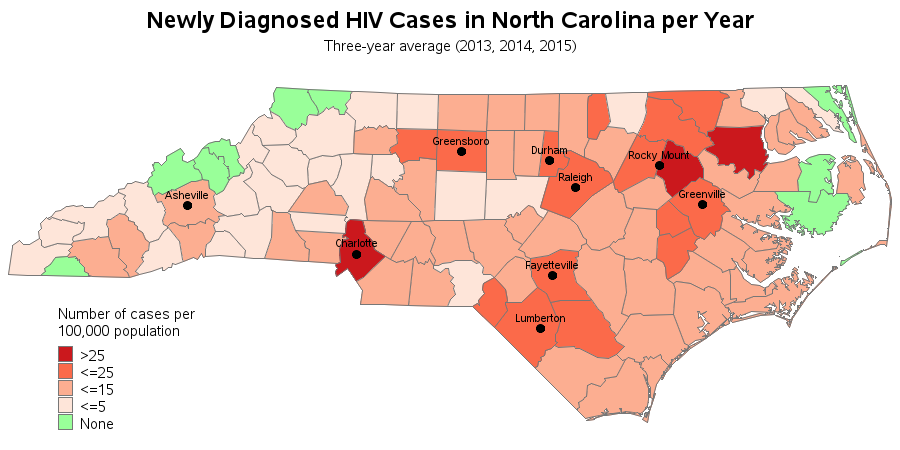
Being an Eagle Scout, the data for good movement caught my attention. I wondered if I could apply my computer skills in a way that might help. How about showing people better ways to visualize HIV/AIDS data - that might help doctors better understand the data, and therefore better treat
Author
Halloween appears to be my favorite holiday, because I seem to have more graphs related to it than any of the others. And since Halloween is just a few days away, I thought you might like an easy way to see all those graphs. Here's are links to my previous Halloween-related blog
The State Fair in North Carolina is just a few miles from SAS headquarters, and therefore it's virtually impossible for it to slip by without me noticing it. There are two aspects of the fair that usually get lots of news coverage - what's the latest fair-food, and did we
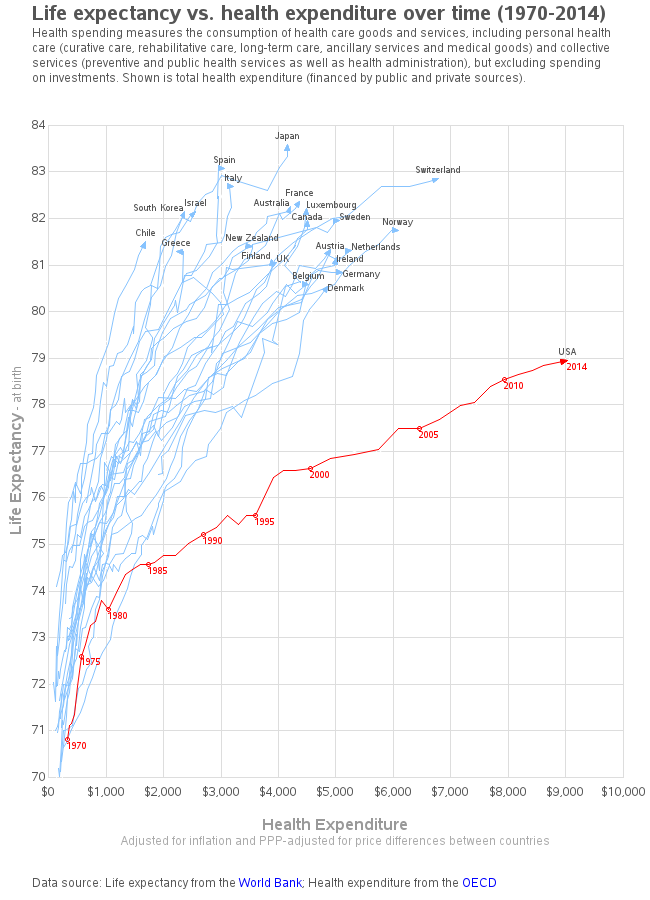
Living to 100 isn't as simple as just paying a certain amount of money for your healthcare. But that is an interesting aspect of longevity, so let's have a look at the data ... In my previous blog post, we analyzed how much people from various countries spend on healthcare.
With the US Affordable Care Act (ACA) and other health topics in the news lately, I wondered how much people spend on healthcare in various countries. Of course spending varies from person to person, so I decided to take a look at the average per capita spending in each country (it's
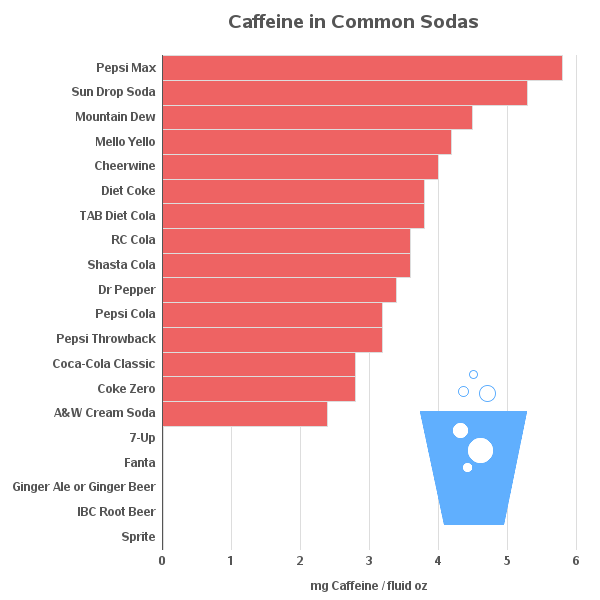
A friend and I were recently debating how much caffeine is in various drinks. I felt like my hands were tied behind my back, since I had no graphs to show them. Of course, the first thing I did when I got to work was create some caffeine graphs! They turned out
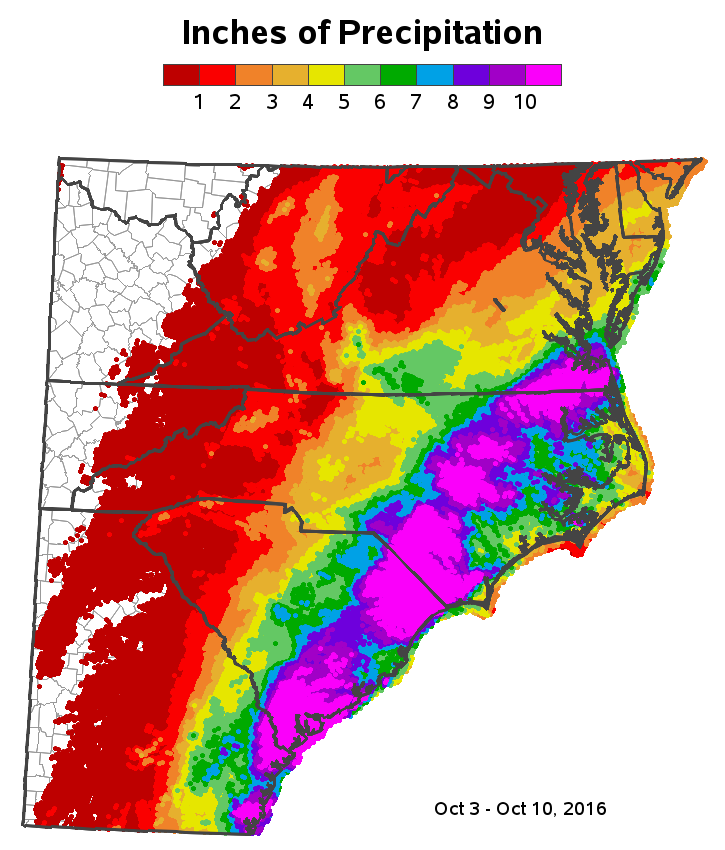
This past weekend, Hurricane Matthew came through the Carolinas. Some areas had record flooding, while other areas didn't. I was anxious to get back to work today, so I could use SAS software and create a custom map showing who got how much rain. But before we get to the official
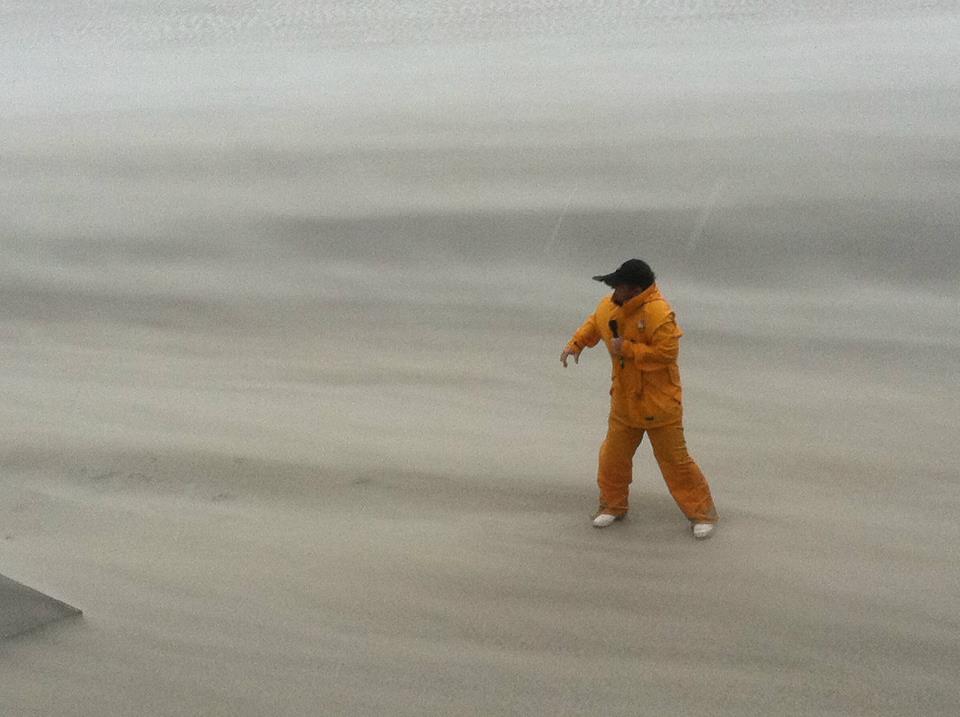
When you were growing up, did you ever imagine that the most popular show on TV would be 24-hour coverage of a storm?!? Yes, for better or for worse, the weather has become our new reality TV. And as you watch the weather coverage, you probably see all the weather reporters showing the
Like many words, if you just say "Cat 5" different people might think you're talking about different things. Computer geeks might assume you're talking about category 5 network cabling. But around this time of the year, most people in the southeast US will probably assume you're talking about a category
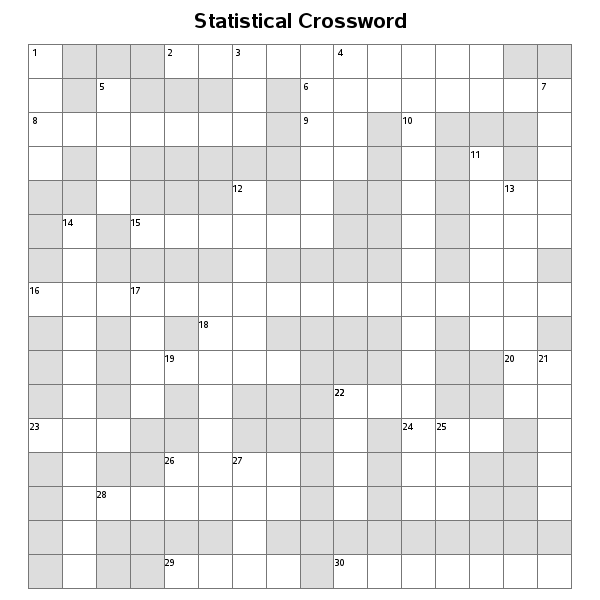
I recently read a very interesting article describing how analytics is being used to detect cheating/copying/re-use in crossword puzzle creation, in some of the major news publications. This inspired me to try my hand at creating a totally new & unique crossword puzzle ... of course using SAS software! :) My grandmother