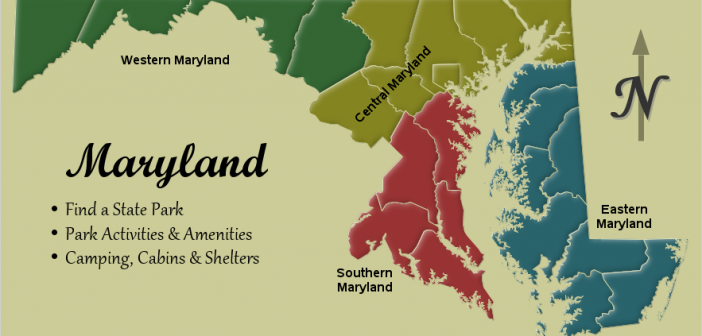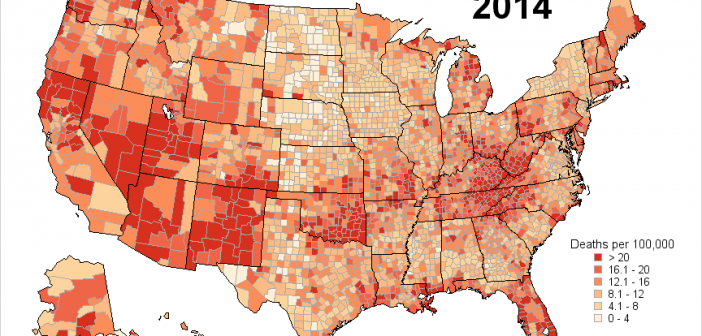
If you're a fan of SAS' ODS Graphics, you probably know that it does pretty much everything except geographical maps. But it's flexible enough that you can "fake it 'till you make it"! This example describes how to fake a geographical (choropleth) heat map using Proc SGplot polygons. In my
Author
If you give an artist some tools, they can create a pretty picture. Sure, they might have a preferred tool - but they can probably do a pretty decent job no matter what you give them (paint, colored pencils, watercolor, charcoal, etc). And creating pretty graphs in SAS is no
When we send spacecraft from Earth to Mars, do the Martians consider them to be UFOs? I might not be able to answer that question definitively ... but I do have some really cool graphs showing the data for all those missions to Mars! You might remember a previous blog
The NC Scholastic Chess Championship is coming up this weekend, and my buddy Michael Thomas asked if I might could create a few graphs to help analyze the event data. How could I pass up an opportunity like that?!?! Read along, and find out what graphs I created, and the
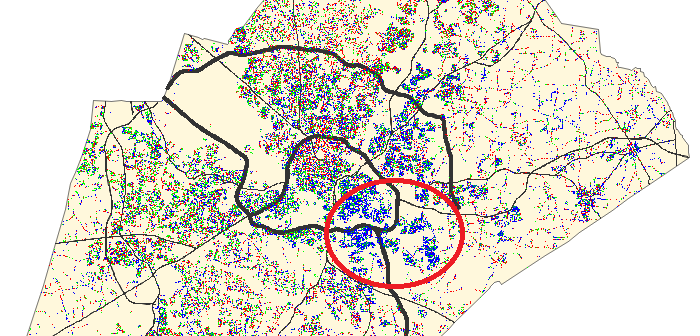
Does your data just look like a bunch of dots? Would you like to bring those dots to life so they can tell their story? This example shows how to make some voter-registration dots a bit more lifelike, so you can see what they're saying. You can apply the same
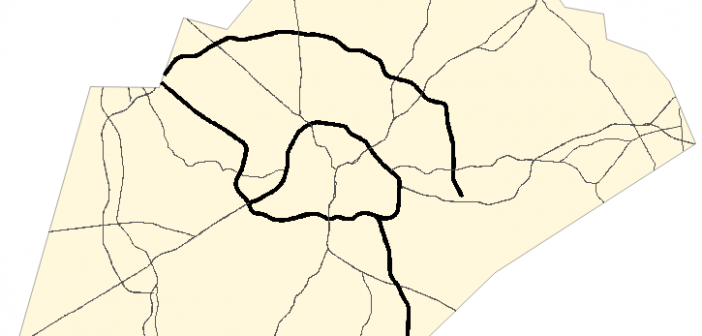
Have you been using the SAS/Graph Gmap procedure to plot your data on maps for years, but never knew you could add roads to your maps?!? Follow along in this blog post, and I'll teach you how... But before we get started, here's a picture of a nice aerial view
Are your friends passing around clever memes (supposedly) featuring something your favorite actor said, or sharing news articles that you think might be "fake news"? If there's even a hint of data analyst in you, then you probably check the actual data, and confirm or disprove the supposed facts yourself. I
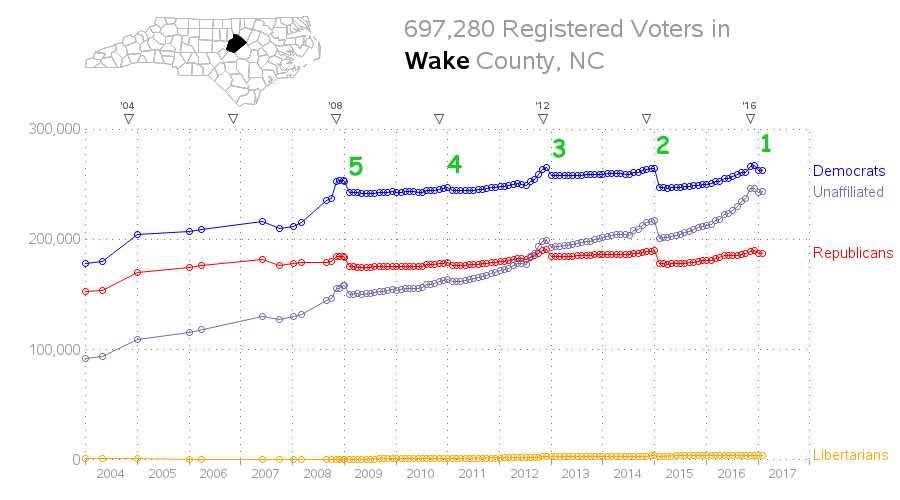
After the recent presidential election, I was updating my graphs of the voter registration data and noticed that the number of registered voters decreased after the election. At first I thought that was odd, but then I realized that maybe inactive voters were being purged. I wanted to find out
A topic that's been in the news a lot lately is the presidential power to grant pardons, commutations, and such. But all the articles I've seen just quoted numeric totals - I haven't seen a graph of the data anywhere! So I set out to find the data and graph
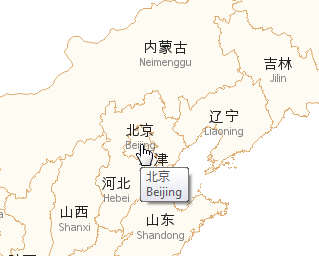
Doing business in a global economy, have you ever found yourself wanting to show Chinese (or Korean, or Japanese) labels on a map? If so, then this blog is for you! Before we get started, here is a photo of some Chinese characters to get you into the mood. This