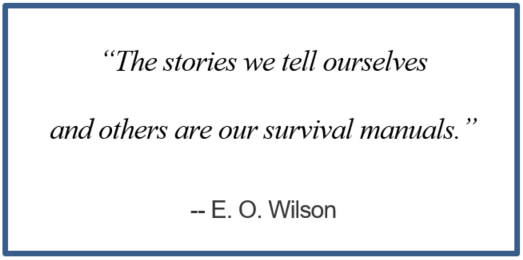
 I continue to find the concept of explaining analytics through storytelling intriguing. As I have written before, at first blush this did not seem immediately clear to me. The advice to use storytelling appeared somewhat vague, trite and without substance. More importantly, it seemed to conflict with the rigor required in analytics. At best I found it to be garden-variety advice somewhat like, “avoid using jargon.” Certainly, it is a fine idea to avoid the use of words your audience does not understand, yet the advice (avoid jargon) gives you no indication of what to do. I will leave avoiding jargon as a topic for another day. Instead, let’s take a deeper look at the storytelling recommendation in order to make it more concrete.
I am always appreciative of explicit recommendations – clear guides as to what to do. Additionally, I am always grateful, as I’m sure most of you are, when the recommendations are based in research. I recently ran across a rather interesting study that meets these requirements. It addressed the storytelling approach used in scientific journals. Clearly the approach of writing in such journals is to be objective and circumspect, but as presented in the work “Narrative Style Influences Citation Frequency in Climate Change Science,” authors Ann Hillier, Ryan P. Kelley and Terrie Klinger present a case for using a readable, interesting narrative style to increase citations. If you are in the scientific world being published is desirable, being cited is even better. Increasing the number of citations certainly sounds like a positive goal.
Most of us in Analytics are not looking for publication in scientific journals, our audience is more local. However, we do want our audience to remember our work and use it. That is our form of citation. If you hear a decision maker repeating a finding from your study, you have been cited, you have succeeded. To hear something frequently referred to, week after week, may be one of the most satisfying results of your work. To see the work implemented is even more satisfying.
In this study the authors defined narrative style through six quantitative indicators. They truly represent explicit advice, clearly have a storytelling aspect to them, and they are found in total to give a positive correlation to citations. (As a side note, the study presents an excellent example of the use of principle components to deal with the co-linearities of the predictors.)
The six indicators are:
- Setting: A description of where and when the event take place.
- Narrative Perspective: The use of first person pronouns.
- Sensory Language: Language appealing to the senses and emotions of the audience.
- Conjunctions: Connecting words and phrases to that bind a narrative
- Connectivity: Referring back to previous sentences or passages, again indicative of a narrative form.
- Appeal: Making an explicit appeal or a clear recommendation for action.
Most of business reporting of studies is done via presentations as opposed to prose, but the stylistic qualities represented here are still excellent guides and concrete recommendations that can be used in a presentation, as well as written work. The narrative style of storytelling is what is important; how personal is it and how does it flow. Explicitly what are we discussing (Setting); what I was able to find out (Narrative Perspective); why this is interesting or important (Sensory Language); the flow a research process building on assumptions and/or previous findings to build a stronger conclusion (Conjunctions and Connectivity); and ending with a recommendation (Appeal).
Next time you put together a report or presentation, consider these indicators. See if you can notice these indicators and use the indicators to improve narrative and storytelling.
Author's Note:
Using the indicators mentioned in this blog, I just reviewed my own work. Here’s how I think I graded out. I think I did only a little with Setting and Sensory Language focusing on the discussion of how it feels to hear your work cited; I did a better job with Narrative Style, it is first person; I did well with Conjunctions and Connectivity; and my use of Appeal, was not so great, at least until I went back and added the previous paragraph. But it is clear to me, the list of indicators used by the authors are concrete recommendations and they do make you think about using a narrative style.
For more explicit recommendations on storytelling, explaining analytics, or just being successful in this field please check out my Business Knowledge Series course, Explaining Analytics to Decision Makers: Insights into Actions. Check the schedule and register today.


