Last week, one of the major pipelines supplying gasoline to the eastern US broke. Do you know where the break is, and which states will be having shortages? Me neither! ... So, of course, I created a SAS map to help...
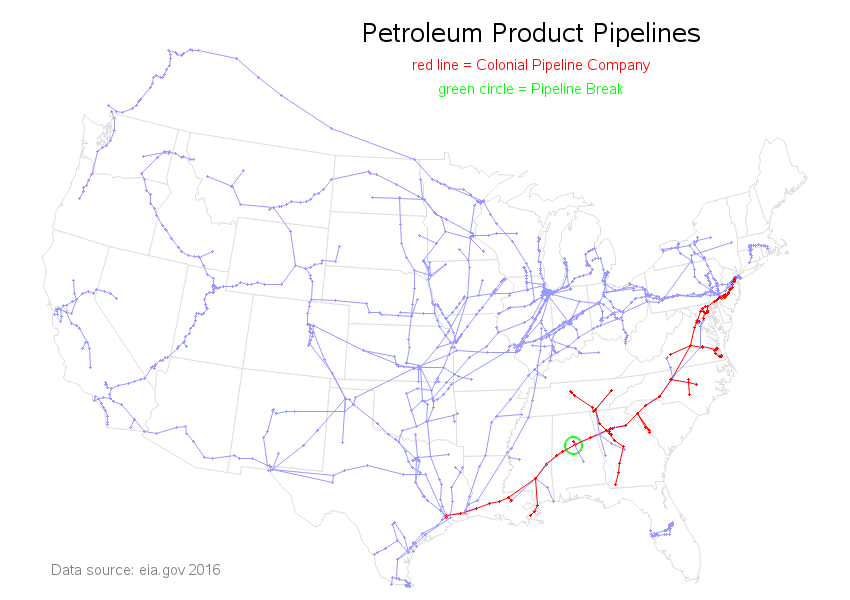
First I read up about the spill on various news sites. It appears this was a 36 inch underground pipeline owned by the Colonial Pipeline Company, that supplied 1.3 million barrels of gasoline a day. The break is in a rural area southwest of Birmingham, Alabama. For some of the states supplied by this pipeline, there are not a lot of other options for getting gasoline.
I did a bit of web searching, and found a shapefile for "Petroleum Product Pipelines". I downloaded and extracted the zip file, and then used Proc MapImport to convert it into a SAS dataset. The dataset contained lat/long coordinates along the various pipelines, and from there it was simply a matter of coming up with a bit of clever SAS code to annotate the pipeline data on a US map.
Here's what I came up with:
Is your state supplied by this pipeline? Are you seeing shortages yet? How long do you think it will take to repair the pipeline?


5 Comments
Pingback: Where is this Dakota Access Pipeline they're protesting? - SAS Learning Post
Would you please superimpose this on an outline map of the contiguous 48 States?
The 48 states are there, in light gray - you might need to adjust your monitor to see them(?)
I didn't want to make the state outlines too dark, because I didn't want them competing with the pipelines.
Cool graph! I've been explaining this to my kids and this chart is helpful.
I went to a service station last night -- not to fill the tank, but to fill my tires with air. The lines for fuel were crazy, winding well into the street -- definitely a panic mentality has set in. I think we've got enough fuel to cover the next few days while this sorts out, but if not...I've got a bicycle.
Yep - the panic leads to hoarding, which makes it even worse. I think the 8 gallons in my Prius should let me ride out this storm! :)