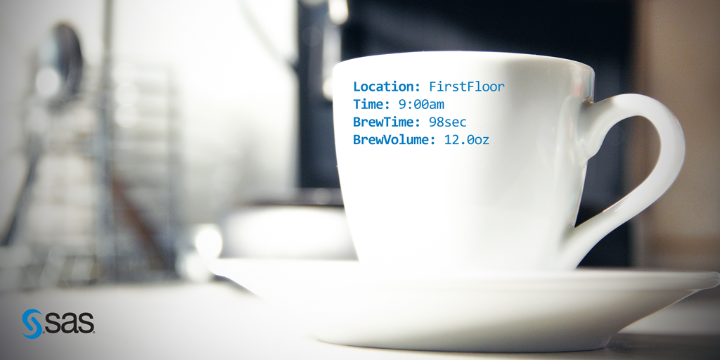
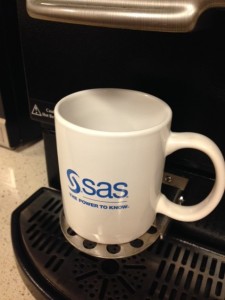
 SAS software is used around the world in some of the most sophisticated ways, like ATM fraud detection and cancer research. But recently, I used it for a practical, and much needed, task -- replacing our break room coffee machine.
Now, this is no ordinary coffee machine. It also makes lattes, cappuccinos, and the luscious iced double mocha frappe (Yes, in addition to M&M’s in our SAS break room, we also have caffeinated treats). It will crank out a simple 12 oz. cup of fresh-ground black coffee in about 90 seconds. Or at least that’s what it’s supposed to do. Over the past few weeks, it had become slow and stingy, taking too long to make too little coffee. Repeated trips by the repair person failed to fix it. The argument being that it was technically making coffee, albeit poorly.
The Data
Some hard data would help clarify the problem, so I brought in a measuring cup and put the stop watch app on my smartphone to work. I collected data for the three machines in my building, one on each floor (I work on the second). I captured the floor, the time of the sample, the time to brew a cup (in seconds) and the volume produced (in ounces). I captured the data on my smartphone as comma separated values, and later transferred the data to my computer hard drive.
Floor, Time, BrewTime, BrewVolume
First, 9:00AM, 98, 12.0
First, 2:30PM, 93, 12.0
First, 3:10PM, 87, 10.5
Second, 7:30AM, 163, 10.0
Second, 9:00AM, 180, 8.0
Second, 11:30AM, 163, 10.0
Third, 7:30AM, 94, 12.0
Third, 11:30AM, 108, 12.5
Third, 1:30PM, 112, 12.5
A scan of the data shows a difference in performance, but how big is it and is it a statistically significant difference? Not easy to tell from the raw data, and this is where SAS comes in.
SAS Studio
I have been using browser based SAS Studio as my programming editor of choice for over a year now, but just last week senior analytical training consultant, Marc Huber, introduced me to the analytics tasks in SAS Studio. Combining tasks with snippets in SAS Studio allowed me to run an analysis of variance (ANOVA) on my data in less than ten minutes.
Snippets
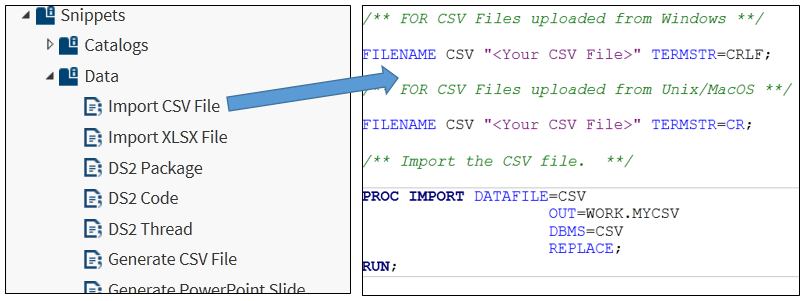
First, I used a predefined code snippet to import my CSV data into SAS. SAS Studio has predefined snippets of code to process data, create graphs, and write macros (you can also write your own snippets for common tasks). Each snippet contains the code framework and with a couple of simple edits (In my case, the location of the CSV file on my hard drive and my data set name), I was off and running.
Tasks
With the data now in SAS, I used an analytics task to run an ANOVA to look for a statistically significant difference. Tasks in SAS Studio provide a menu driven interface to build SAS procedures. There are tasks for a variety of statistical, graphic, econometric, and data manipulation tasks. In this case, my one-way ANOVA task built GLM and UNIVARIATE procedures for me, after I provided a data set (WORK.COFFEE), a dependent variable (BrewTime) and an independent variable (Floor).

Results
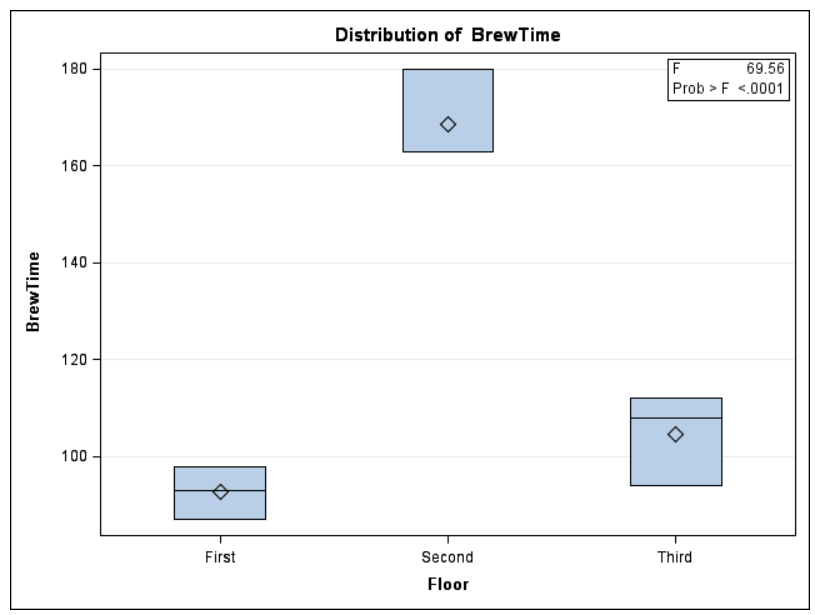
Not only did I find a big difference between floors for both brew time and volume, it turned out to be a statistically significant difference even though my sample size was small. Here is my box plot for brew time:
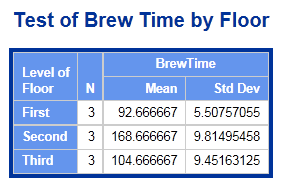
Here are my means and standard deviations:
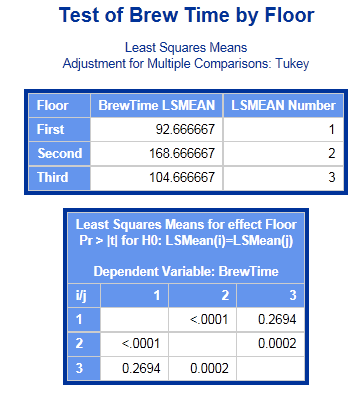
And most importantly, here are my LSMeans and P values, showing a statistically significant difference (at an alpha of .05) between first and second floors, and also second and third floors. Also note that even though there is a difference in performance between the first and third floors, this difference is not statistically significant.
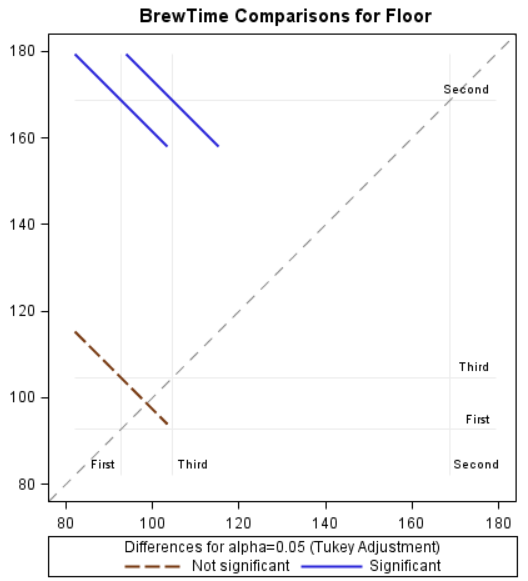
Or graphically:
Outcome
With my report in hand (it is easy to output PDF and RTF from SAS Studio), I submitted my results to maintenance on a Thursday morning. By Friday, I had a ‘thank you for the analysis’ note and more importantly, a new coffee machine in the break room.
SAS software is a powerful tool used across industries to solve real world problems with data. This is a simple (and admittedly somewhat silly) example of that power. With its combination of zero footprint installation, ability to run in the browser on Windows/MAC/Linux, and efficiency tools such as tasks and snippets, SAS Studio is a great resource for new and experienced programmers to tackle those problems.
For more on SAS Studio, here are more than thirty video tutorials from SAS Training that cover basics, graphing, and statistical analysis. If you take any of our foundation classes such as Programming 2 in the classroom or remotely via Live Web, you will be able to choose between Display Manager, Enterprise Guide, or SAS Studio for your exercises.

8 Comments
Neat story. If you run a second test, you should consider adding brew temp as an additional variable. Results from a larger sample size would be interesting.
This is a great idea
Very nice post Mark, and thank you for posting it, Leslie!
Love the unique ability to geek out over coffee brew time. Thanks Mark for showcasing the power of SAS software in a very cool way.
Sooper research and nice way to start you predictive research
Now if you could only predict the failure rate for the dreaded 'drip tray full' error.
And then build the model into the software of the coffee machine to call for help before the error occurs. #IoT.
Great Post Mark.. I'll have to visit you in Cary & test out your 1st floor Coffee speed brewing statistics..:)