Everyone is intrigued by natural disasters - can we predict the likelihood of multiple disasters happening simultaneously?...
My friend Rochelle is an avid SCUBA diver - here's a photo of a shark she got to 'smile for a picture' on a recent dive trip:

Rochelle was asking if I could use SAS to forecast the probability that hurricane Arthur would cause her upcoming dive trip off the North Carolina coast to be canceled. I'm not enough of a domain expert to forecast specific weather events, but I thought it would be interesting to look at the historical hurricane trends, and see what I could come up with...
Here in the US, we're right at the beginning of the hurricane season, and just finishing up the tornado season. Which got me wondering - is it possible that we could have both a hurricane and a tornado at the same time? And in the spirit of the 'B' movie Sharknado, I decided to call such combinations of multiple natural disasters "sharknadoes".
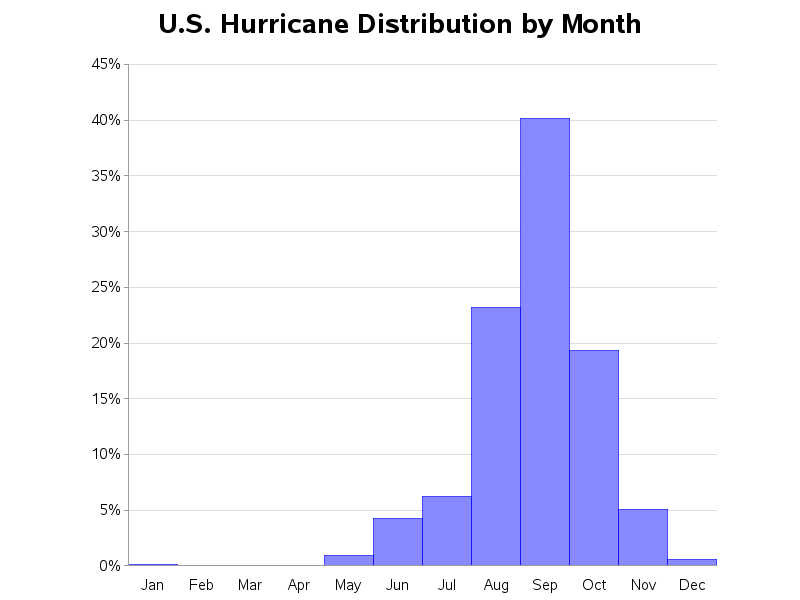
I first took the data for Atlantic hurricanes, and created a histogram showing the % of hurricanes which occurred during each month:
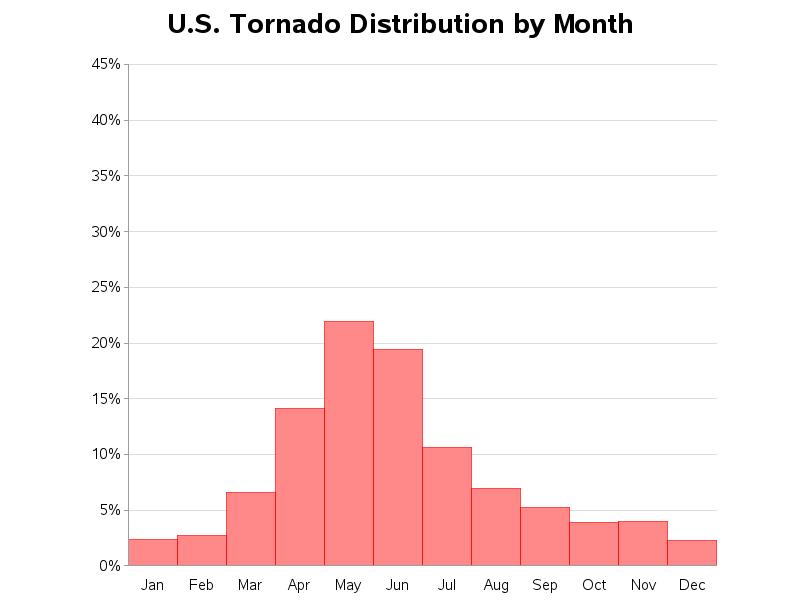
Next I took the data for US tornadoes, and created a similar histogram showing the % of tornadoes which occurred during each month:
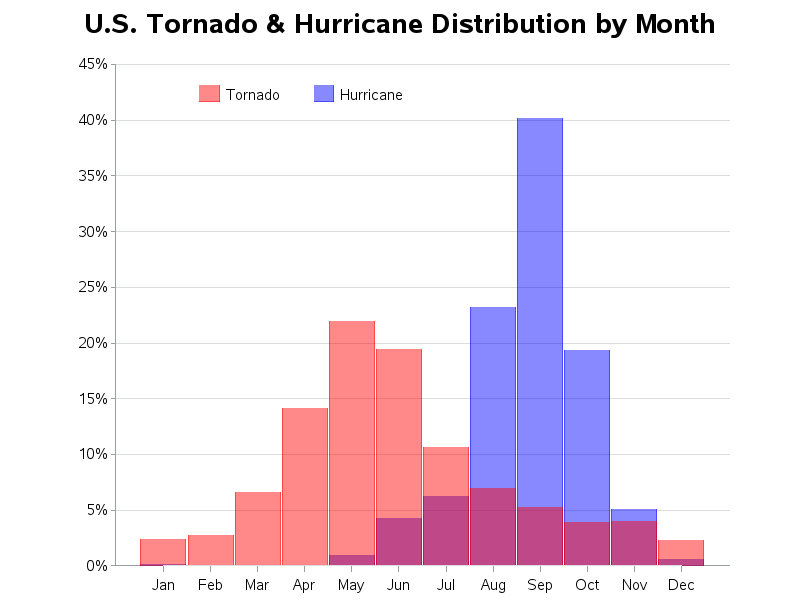
And then, to determine when a hurricane/tornado sharknado might occur, I plotted both sets of data together using Proc Gplot with the needle interpolation and transparent colors. The tornadoes are red, the hurricanes are blue, and the time when they might both occur is purple. Looks like August is the month with the highest probability of a hurricane/tornado sharknado! :)
So, have you ever experienced a natural disaster "sharknado"? What combination of natural disasters did you experience at the same time? (or close enough together that you were still recovering from the first, when the second hit)


6 Comments
Robert, shouldn't be these probabilities multiplied to see probability to observe both events at the same time/month?
Hahaha - yeah, a lot of changes would need to be made, and assumptions states, to make this a rigorous scientific study! Perhaps it would make a good topic for a real statistician to address in a paper for SAS Global Forum! :)
Robert,
Thanks for this. We here in Virginia got hit by a hurricane and an earthquake within the same week 3 years ago.
I would be interested in playing around with the data and code for the combo chart if you could post it.
Thanks,
Brian Adams
Ahh! - A rare & interesting sharknado scenario! :)
Here's a link to the code - it shares some code/data with other examples in other folders, so you'll have to look in those folders for the other bits & pieces (you should be able to intuit the url of those pieces, via the relative pathnames in the SAS code).
http://robslink.com/SAS/democd72/hurricane_tornado_info.htm
An interesting fact: the dates for Hurricane Season are chosen so as to "encompass over 97% of tropical activity." For details and to see the computation yourself, see the article "Using data to define hurricane season."
Interesting details, there!