 How can a solar farm ensure peak energy production? And what factors can be adjusted to optimize production throughout the day, the week and season-by-season? These are just some of the questions that a team of data scientists have asked and answered about the SAS solar farm using data, drones and computer vision.
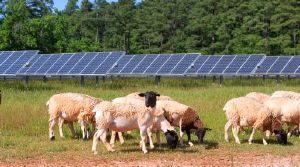
The SAS solar farm provides clean energy to the corporate campus in Cary, NC. To ensure peak production, the solar panels follow the sun across the sky.
Employees love wandering the lush trails around campus and seeing a solar farm dotted with grazing sheep on one side and a tree-lined pond on the other. But one group of data scientists at SAS, have been especially inspired by landscape to spark creative thinking, combine passions with work, and to test new ways to use SAS software.
For Diana Shaw, manager of AI technologies at SAS, the solar farm has become a playground for her team’s creativity and passions. They used chatbots, natural language processing, computer vision, forecasting enhanced by machine learning – and yes, a drone – to find and implement ways to improve the production of energy from the solar farm.
How the chatbot works
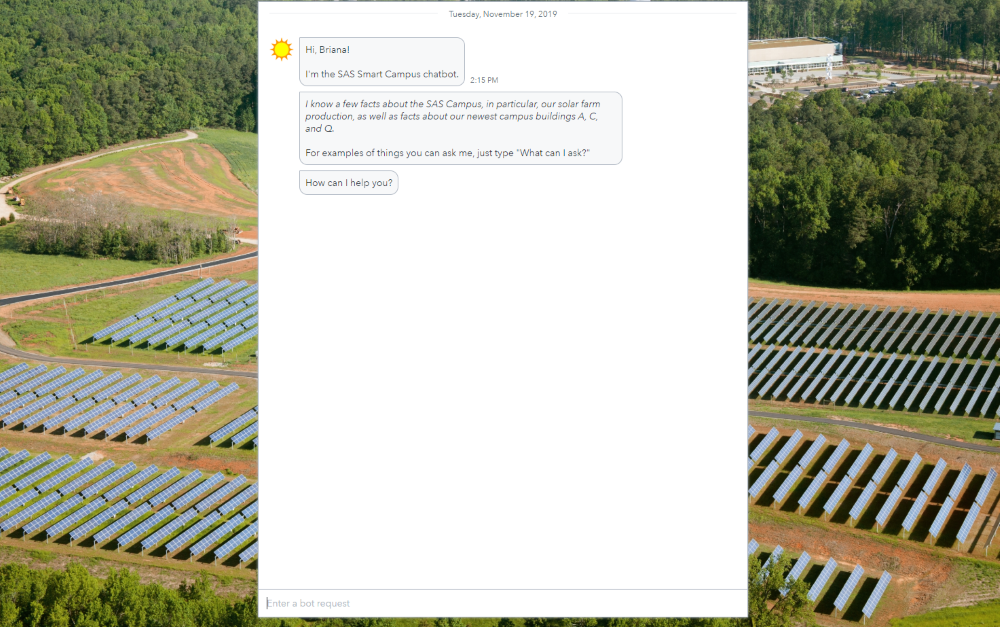
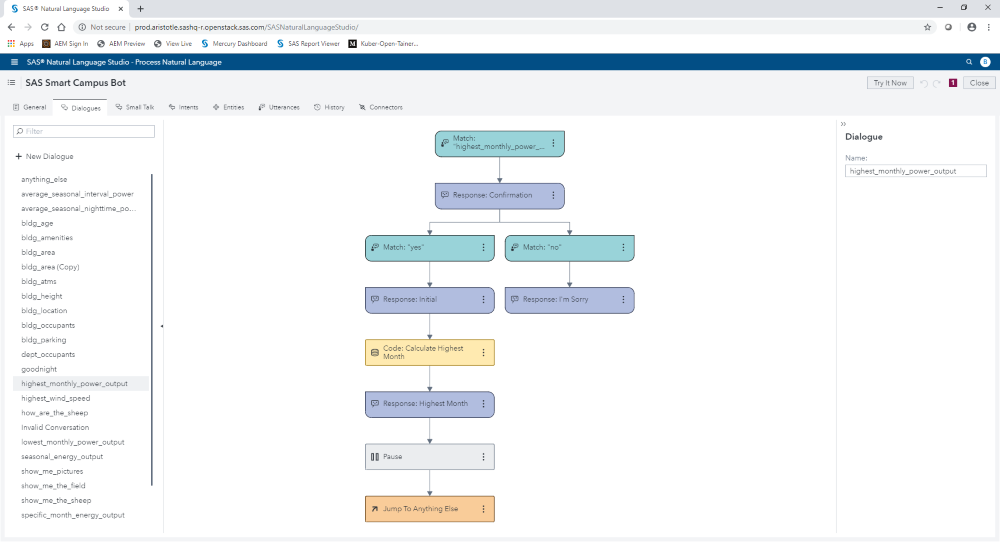
First, the team leveraged the SAS chatbot framework to ask questions about the solar farm and receive answers. The chatbot uses natural language to consume information, interact with a visual report, and provide answers. Forecasting and machine learning technology operate in the background so the chatbot can provide predictions about energy output. The prediction accuracy of the forecast model is enhanced with a recurrent neural network machine learning algorithm so it is continually learning and updating based on data coming in.
When the team asked the chatbot, “How is solar farm production compared to the forecast?” they realized the solar farm production was running 7% below expectations. The report and the chatbot then highlighted potential issues. (SAS’ natural language support powering the chatbot supports 30+ different languages.)
The visual report and chatbot framework are API-driven. This allows users to access and view the report remotely from a phone, tablet, computer and other devices. Instead of trekking over to the solar array to “see” what was causing the farm to run 7% below expectations, the team decided to use computer vision
To find the answers, they relied on historic drone footage of the solar farm, computer vision capabilities in SAS Visual Data Mining and Machine Learning and simple-to-code DLPy. DLPy is a high-level Python library for SAS deep learning features. It applies deep learning methods to image, text and audio data efficiently. DLPy APIs follow the Keras APIs with a touch of PyTorch flavor. The team used these resources to create a tiny-yolov2 algorithm, which is a form of a convolutional neural network (CNN) that is used to quickly identify objects that can be ascertained in a single glance.
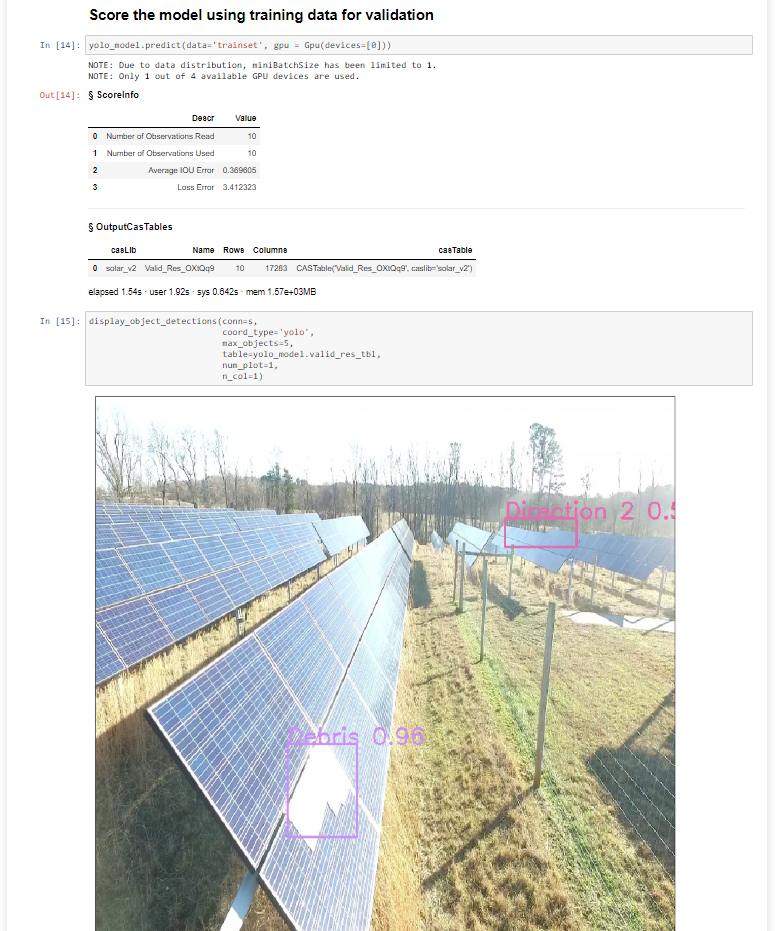
The tiny-yolov2 model makes this complex computer vision model easy to code with simple syntax and easy to deploy anywhere with a simple line of code – even on a drone! The model predicted if the solar array was pointing towards the east (Direction1 in image below) or towards the west (Direction2) and identified when panels were covered with large debris (Debris). All of these factors can influence energy production.
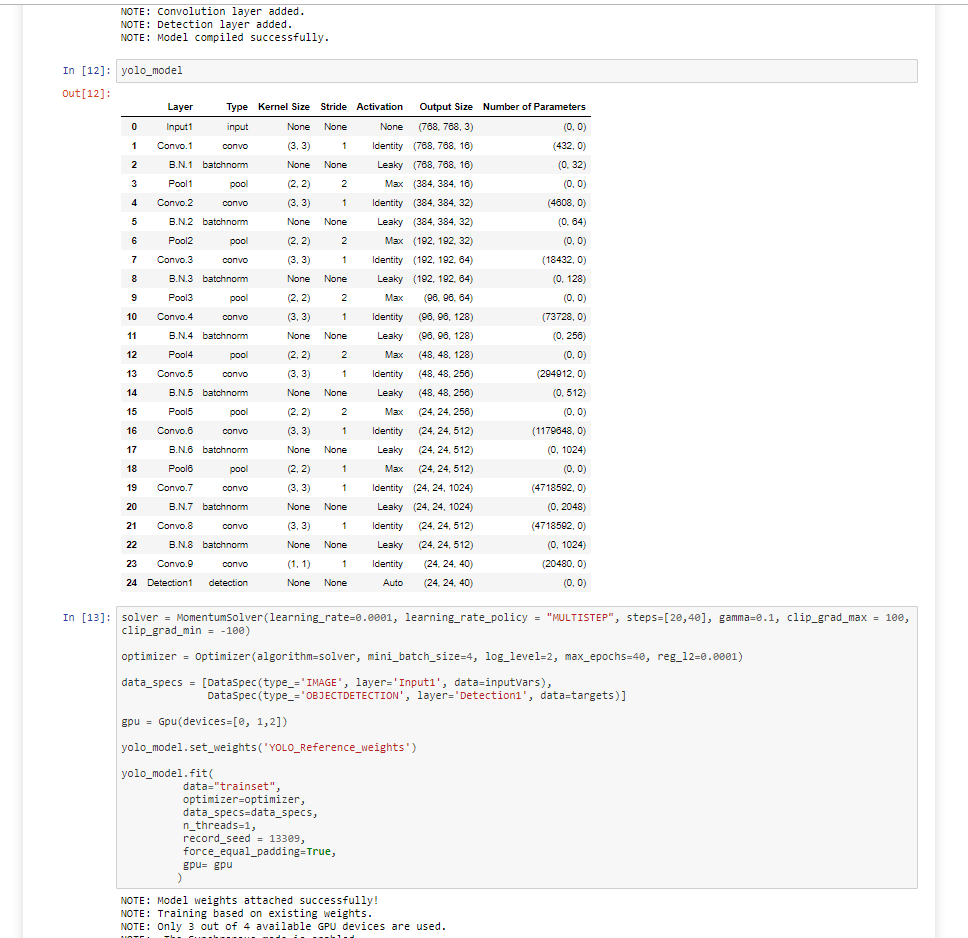
To identify these factors, the team identified and labeled training examples to feed the tiny-yolov2 model. Ultimately, their model had 25 layers including 9 convolutional layers, 6 pooling layers and 8 batch normalization layers. CNNs can be very complex, but the team opted for a CNN model that only had 11,029,424 parameter weights and 714MB of memory cost for training, which can often compile faster with GPUs.
SAS supports GPUs for a wide range of machine learning algorithms including the tiny-yolov2 model, and supports ONNX so that models can be deployed wherever work needs to be done – including iPhones and Android phones. Models from Tensorflow, Pytorch or other open source models can be ingested and incorporated into the SAS platform for execution.
Deploying the computer vision model on drones
With the complex model created, the team efficiently and effectively operationalized this model in real time, on a drone equipped with SAS Event Stream Processing using an ASTORE of the tinyyolov2 model. A SAS ASTORE is a binary file that contains the state from a predictive analytic procedure, which can be easily transported from one host to another and acts as a warm restart for scoring. When the tiny-yolov2 ASTORE ran on new solar farm drone footage, the computer vision model scored the predictive model in real-time.
As the team flew the drone over the SAS solar farm, real-time scoring of the SAS computer vision model detected the positions of solar array panels. When the drone detected by east-facing and west-facing panels simultaneously, it automatically generated an email alert to notify the solar farm operations department that a section of the tracking system failed – which was causing power production problems.
Essentially, this automated approach sent an email to the right people, so actions could be taken quickly to get the solar farm back up to typical production levels.
Inspiration becomes innovation
Diana’s team completed this PoC by looking at the SAS solar farm in a new light and using unconventional thinking – and a love of tinkering with new technology – to find a solution. This project is the first of many that will be highlighted in our new blog series, Making AI Real, which focuses on the fascinating ways that AI intersects with and impacts our lives.
Learn more
Some aspects of AI applications involving computer vision and natural language processing can involve layers of complexity that call for capabilities enabled by deep learning. To explore what’s possible with deep learning using SAS, consider downloading this paper: How to do deep learning with SAS.
In it you’ll find details about the different neural networks supported by SAS, as well as some examples of how organizations have applied deep learning techniques to real business situations using SAS, and more.