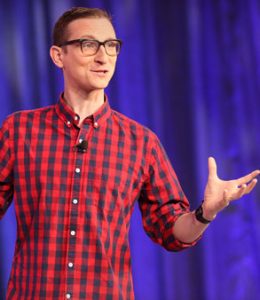
When Jake Porway, Founder and Executive Director of DataKind, bounded onto the stage at Analytics Experience this week, he spoke of a few of these superheroes who recently came together, hackathon style, in Seattle, Washington, to look at satellite data and infrared models just to locate all of the likely wheat farms throughout Ethiopia. Integrations with Google Maps and visual analytics allowed them to find and predict which of those farms had wheat rust – with 80-percent accuracy, by the way – and where this devious disease was headed next. This information is now allowing partner Bill & Melinda Gates Foundation to contact farmers in practically real time to suggest shifting crops or applying preventative pesticides.
All this from a team of volunteers working together for just two days.
“This work has bigger impact than you might imagine,” said Porway. “For organizations that don’t have access to this stuff, it’s like magic. It’s incredible. It’s like sci-fi.”
Magical, incredible, sci-fi, indeed. But Porway still believes it’s day-to-day doable and data scientists have it in them to perform these tricks on a repeatable basis, and not just to sell things or predict the next book or movie you might enjoy.
“We’re in frontier times in using data for good,” said Porway. “Give data scientists a chance to have social impact. Give social organizations a chance to maximize their impact, and in the process we get to live in a better world.”
Take the Red Cross challenge, for example. When the Red Cross realized that more than 25,000 people in the US die each year from faulty smoke alarms, they set out to put 2 million working devices in homes across America, with the hope of reducing the death rate by 25 percent. Great idea, right? But their good intentions came to a screeching halt when they stopped to consider, “Where do we place these 2 million devices?”
They turned to DataKind for answers.
DataKind volunteers encouraged the Red Cross to look at a number of different data sets, including their own Red Cross data, official fire inspections, and survey data to help build a three-tiered model to predict where these fires could happen and the communities least likely to already have smoke alarms. They even predicted which of these fires were most likely to result in injury, based on historical data. The American Red Cross now has the insight to know where to focus, and the organization has already placed more than 400,000 smoke alarms.
“This results in more than a campaign that just sounds good but doesn’t get to the root of the problem,” said Porway.
He believes a data for good project requires careful attention to six different components:
- A well-defined problem statement, which he finds the most difficult, time-intensive and expensive part of the process. “Finding problems can be harder than finding solutions,” he said.
- Data sets. These can include satellite data, publicly available data, survey data and more.
- Data scientists.
- Funding.
- Subject-matter expertise. “We don’t just want to build a lot of projects,” he said. “We want to do something like reduce homelessness, and that’s not a hackable problem.” He advised to get knowledgeable, connected people in the room; otherwise, you can build something that won’t be used or could be used incorrectly.
- Social activists on the ground.
Porway praised SAS for its commitment to using analytics for good, noting that the company got its start with a focus on sustainable agriculture. “Using data for good is in the DNA of this organization, which is so exciting because you don’t see that in every corporation.”
He went on to shine light on SAS’ work with the Boston Public School System, which is working to optimize school bus routes for more than 33,000 students and a related project focused on improving overall school attendance.
Focusing on solving the real problem and not just building something interesting is key, said Porway. “The work isn’t done when you get the result; the work is done when you understand how the people who are going to use it are going to be influenced by it.”
“This is a huge communal effort,” Porway said. “It’s why we use the word ‘movement’ because it’s really only when we’re all involved … that we’re going to go beyond just using data to make better decisions about what kind of movies we want to see to using data to make better decisions about the world we want to see.”
Interested in learning more about the Data for Good movement? Visit the DataKind website.
View the talk in its entirety on the Analytics Experience video archives.
