Downstream data have been electronically available on a weekly basis since the late 1980s. But most companies have been slow to adopt downstream data for planning and forecasting purposes. Let's look at why that is.
Downstream data is data that originates downstream on the demand side of the value chain. Examples include retailer point-of-sale (POS) data, syndicated scanner data from Nielsen, Information Resources Inc. data and Intercontinental Marketing Services (IMS) data.
Prior to electronically available downstream data, manufacturers received this type of data in hard copy format as paper decks (after a 4-6 week lag). Once received, the data points were entered into mainframes manually via a dumb terminal (a display monitor that has no processing capabilities; it is simply an output device that accepts data from the CPU).
In fact, downstream data have been available to consumer products manufacturers for several decades. Subsequently, the quality, coverage and latency of downstream data have improved significantly, particularly over the past 20 years, with the introduction of universal product barcodes (UPC) and retail store scanners.
Today, for many companies, data management capabilities have advanced so quickly that the challenge now is how to report and make practical use of it all.
Data storage costs have fallen significantly over the past decade. Sales transaction data is being captured at increasingly granular levels across markets, channels, brands and product configurations. Faster in-memory processing is making it possible to run simulations in minutes that previously had to be left to run overnight.
In fact, companies receive daily and weekly retailer POS data down to the SKU/UPC level through electronic data interchange transfers (electronic communication method that provides standards for exchanging data via any electronic means). These frequent data points can be supplemented with syndicated scanner data across multiple channels (retail grocery, mass merchandiser, drug, wholesale club, liquor, and others) with minimal latency (1-2 week lag) by demographic market area, channel, key account (retail chain), brand, product group, product, and SKU/UPC.
Consequently, downstream data are the closest source of consumer demand above any other data, including customer orders, sales orders, and shipments. Unfortunately, most companies primarily use downstream data in pockets to improve sales reporting, uncover consumer insights, measure their market mix performance, conduct price sensitivity analysis, and gauge sell-through rates.However, no manufacturer including consumer packaged goods (CPG) companies have designed and implemented an end-to-end value supply chain network to fully utilize downstream data.

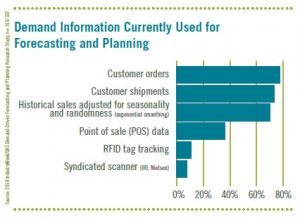
According to a recent 2014 Industry Week demand-driven forecasting and planning study, the least two data sources being used for demand forecasting and planning are POS and syndicated scanner data (see Figure 1).
It is apparent that companies' supply chains have been slow to adopt downstream data although POS data from retailers have been available for decades. Initially, it was a matter of data availability, storage, and processing. Today, it is primarily a question of change management due to corporate culture, particularly from a demand forecasting and planning perspective.
So what are the barriers? In large part, the slow adoption rate is because the organization has not approached the use of these new forms of downstream demand data from a holistic standpoint. Instead of mapping new processes outside-in, the organization has tried to force-fit this data into existing processes using Excel with no real analytics, and a lot of manual manipulation.
Despite the fact that channel data are now available for anywhere from 50-70 percent of the North American retail channels, and the use of the data has decreased data latency in the supply chain by 80-100 percent, many companies feel it can’t be used for demand forecasting and planning.
Meanwhile, confronted with demand challenges, companies have been looking for new ways to predict future demand in the face of a progressively volatile marketplace. The traditional demand planning technology under these changing conditions has been ineffective at predicting future demand.
The main reason for the unsuccessful performance of traditional technology is directly related to the fact that most companies are not forecasting demand. They are forecasting supply, which is proven to be much more volatile because it produces what is referred to as the “bullwhip effect.”
Customer orders, sales invoices, and shipments are not true demand. They are the reflection of retailer and manufacturer replenishment policies (supply). To make matters even more difficult, traditional demand forecasting processes and enabling technology were not designed to accommodate POS and syndicated scanner data, let alone the more sophisticated analytic methods required to sense demand signals and shape future demand to create a more accurate demand response.
To reduce volatility and gain insights into current demand trends, companies are turning to POS and syndicated scanner data, but are finding that using them for demand forecasting is complex. Perhaps it is because they are not familiar with downstream data, as most demand planners report into operations planning too far removed upstream, rather than downstream in marketing. Another reason is that most companies do not collect downstream data on an ongoing basis over multiple years. They normally collect it on a rolling 104-week basis. This trend is no longer a barrier as companies are creating demand signal repositories (DSRs) to capture downstream data by week for more than 104 weeks to allow them to compare downstream consumer demand to upstream shipments and/or sales orders.
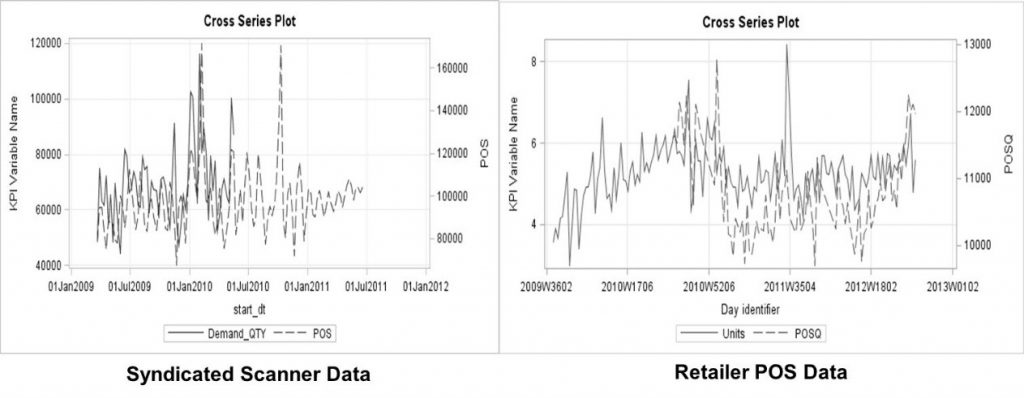
Others will tell you that what retailers sold last week, or even yesterday, is not necessarily a good predictor for what they will order next week or tomorrow. This is another myth, as companies have been keeping inventories low with more frequent replenishment because retailers are not allowing manufacturers to load their warehouses at the end of every quarter with their products. As a result, there is a direct correlation with weekly POS/syndicated scanner data at the product level, and in many cases at the SKU/UPC level (see Figure 2). As you can see in both cases there is a strong correlation between weekly retailer POS and shipment data, as well as weekly syndicated scanner and shipment data. Most manufacturers now capture their shipment data weekly by channel and key account down to the SKU/UPC demand point.

Another barrier has been scalability. Many companies feel that adding downstream channel data to demand forecasting involves a magnitude of effort and complexity that is well beyond what most companies can handle to source, cleanse, and evaluate the range of data. However, new processing technology (e.g., parallel processing, grid processing, and in memory processing) leveraging advanced analytics in a business hierarchy along with exception filtering has enabled several visionary companies to overcome these difficulties. The promise of downstream data can be realized with the right technology on a large scale.
The only real barrier is your corporate culture, internal analytical skills, and the desire to take that first step. So, what are you waiting for? In fact, the best way to get the commercial side of your business (sales/marketing) to participate in your sales & operations planning (S&OP) process is to integrate downstream data into the demand forecasting and planning process. Without it there is no real reason for sales and marketing to participate.
Downstream data are the sales and marketing organizations “holy grail” to consumer demand.
To learn more on this topic, order the book, Demand-Driven Forecasting: A Structured Approach to Forecasting.

2 Comments
brilliant article Charlie. A
Alejandro, glad you liked this posting.
Thank you for all your support and kind words!!!