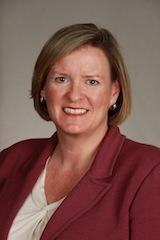
Kimberly Holmes doesn't want to put any limits on what analytics can accomplish at XL Group plc. As the Head of Strategic Analytics, Holmes recently selected SAS Visual Analytics to help the global insurance and reinsurance operations at XL Group meet that lofty goal.
We spoke with her at a recent SAS event to learn more about the importance of asking questions of your data and to hear about the inspiration she receives from visual representations of her company’s data.
"Data visualization will enable us to clearly communicate complex statistical insights to our colleagues and encourage more widespread use of analytics in business planning and decision making across XL," she said. Keep reading to learn more about Holmes and her team at XL Group.
Do you think the term “analytics” is overused right now?
Holmes: The word analytics has become ubiquitous over the last 10 years and is used to describe everything from raw data to management information, to traditional actuarial analysis, to cutting-edge advanced analytics. All of these are important, but to me, analytics is about decision science and being innovative in the data we use and the methods of analysis we use to improve decision making. It’s about being “the chief pattern spotter” and developing creative feedback loops of continual learning.
How does your group get "buy-in" for analytics?
Holmes: One of the things we do from day one in model development is to work closely with the business. I actually think most of the businesses that work with us would say they had woefully underestimated the amount of time they would spend with us and the decisions they would have to make. We’re a facilitator for them. They make most of the decisions and use our guidance where needed. We work with the business to develop a portfolio approach to implementing analytics. It’s about finding where in the market certain types of risk are being overcharged compared to where the prices should be and creating a strategy out of that. Yes, there will probably be some tough conversations, some rate increases and some non-renewals, but when one door closes another opens. We create a model implementation strategy to generate more of the best business and less of the worst business.
Why did you choose SAS Visual Analytics?
Holmes: That was a very interesting day when I saw SAS Visual Analytics for the first time. I actually wished I had a tape recorder in my brain for all the ideas that went through my thought processes as I was watching the demo. Going back to the question of how we can get business buy-in, SAS Visual Analytics embodies the saying, “A picture speaks a thousand words.” If we can show information visually and communicate advanced statistical concepts in a visual way, it will be much more effective than if we present charts and numbers and correlations. Just seeing the demonstration about a fake toy company made me think about a lot of questions we could ask about our business if we were using SAS Visual Analytics. This is key. Our success depends on asking more questions, finding the answers and using that insight. If you don’t ask the question, you’re not going to discover the insight. What SAS Visual Analytics will do is inspire more questions than we ever would have asked before.
What types of unexpected outcomes have you experienced using analytics?
Holmes: We rolled out four new multi-variant predictive models in August for one of our businesses. Fifty percent of the variables in those models are totally new variables that we weren’t considering before, and these variables account for over half of the power of those models. What’s interesting is that sometimes the reaction of an underwriter who’s been underwriting for 20 years is “Well, I never thought of that before.” Or, “How could that be?” We send the message that even if we can’t articulate what the causal relationship in the variables is, the correlation is there and we have to believe it because it was based on 70,000 policies.
See for yourself: visualize data from your industry.
