After a marathon of a season, 162 games in each team's schedule to be precise, the stakes for Major League Baseball are higher in October, and postseason play is underway. Whether it's the renewal of an old rivalry, redemption for last year's runners up, or rooting for this season's breakout rookie sensation, baseball fans have plenty to cheer for each fall. In addition to being a celebrated American pastime, baseball is a sport whose structure lends itself to many flavors of statistical analysis.
This article demonstrates how you can use SAS to quantify past years' batter versus pitcher statistics. You can use these historical trends to highlight the matchups to watch out for this postseason. The article also lays the groundwork for solving a lineup optimization problem. This problem is of great interest to fantasy buffs, hobbyists, as well as actual MLB managers!
The data source
One abundant source of Major League Baseball data is the event files archived by season at Retrosheet.org. The code below assumes that the files for each year of interest YYYY have been downloaded and extracted into a subdirectory called YYYY. Each event file (one per team, per year) contains game event logs for all home games of a particular team in a particular season. Events recorded per game include information about starting rosters, substitutions, umpires, and game conditions. In addition, they keep a record of every play-by-play event in the game.
Parsing complex event files
Because of the intricacies of baseball score keeping, a detailed notation is used to describe what happened in a baseball play. For the purpose of this blog, however, you can greatly simplify the game data by simply determining whether a particular at bat ended up with a hit or with no hit. Using a regular expression, you can parse this result string to determine which at bats resulted in a hit, and which did not.
Note that many events are neither positively nor negatively considered when computing batting average -- walks and hit-by-pitch, for example -- these events are ignored for this analysis.
To do this, you can parse the raw data as follows:
As you read through the file
- keep track of the current pitcher for the home and away teams (see /* 1 */ and /* 2 */ below)
- do this by checking for a "start" or "sub" event where the position is listed as a pitcher (position code=1)
- store the pitcher id in the appropriate variable
- identify which plays result in a hit or no hit (see /* 3 */ through /* 6 */ below)
- do this by parsing the result string that corresponds to each play
- record the batter, pitcher, and outcome of each applicable play as an observation in the output data set (see /* 7 */ below)
%macro loadYears(YEAR_START, YEAR_END, DATASET, LEAGUE=MLB, DIR=C:/data/baseball);
/** Specify N or NL to import only National League home team data files **/
%if &LEAGUE = NL %then %let LEAGUE=N;
/** Specify A or AL to import only American League home team data files **/
%else %if &LEAGUE = AL %then %let LEAGUE=A;
%else %let LEAGUE=*;

data fileList;
   length filename $ 100;
   do YR=&YEAR_START to &YEAR_END;
      filename=CATS("&DIR/",YR,"/",YR,"*.EV&LEAGUE");
      output;
   end;
   drop YR;
run;

data &DATASET;
   length pitcher $8 batter $8 outcome 4 event $30;
   if _N_ = 1 then do;
      /** Prefixes that indicate a hit **/
      hitPrefix0 = "S\d"; /* a single */
      hitPrefix1 = "D\d"; /* a double */
      hitPrefix2 = "DGR"; /* a ground rule double */
      hitPrefix3 = "T\d"; /* a triple */
      hitPrefix4 = "HR";  /* a home run */

      /** Prefixes that indicate no hit **/
      noHitPrefix0 = "[1-9]"; /* an out in the field */
      noHitPrefix1 = "FC";    /* a fielder's choice */
      noHitPrefix2 = "E";     /* a fielding error */
      noHitPrefix3 = "K";     /* a strikeout */

      /** Build a regular expressions that check the prefixes **/
      expHit   =  "/(" || hitPrefix0 || ")|(" || hitPrefix1 || ")|(" || hitPrefix2 || ")|(" || hitPrefix3 || ")|(" || hitPrefix4 || ")/";
      expNoHit =  "/(" || noHitPrefix0 || ")|(" || noHitPrefix1 || ")|(" || noHitPrefix2 || ")|(" || noHitPrefix3 || ")/";
      retain reHit;   /* regular expression matching a hit event */
      retain reNoHit; /* regular expression matching a no-hit event */
      reHit = prxparse(expHit);
      reNoHit = prxparse(expNoHit);

      /** Error checking will tell if the regular expression is invalid **/
      if missing(reHit) then do;
         putlog "ERROR: Invalid expression " expHit;
         stop;
      end;
      if missing(reNoHit) then do;
         putlog "ERROR: Invalid expression " expNoHit;
         stop;
      end;
   end;

   set fileList;
   infile dummy fileVar=filename end=done DLM=',' DSD MISSOVER;
   do while(^done);
      format pitcherHome $10. pitcherAway $10. pitcher $10.;

      /** need the current home and away pitchers to carry over between observations **/
      retain pitcherHome pitcherAway;
      input eventType $ col1 $ col2 $ col3 $ col4 $ col5 $ col6 $;

      /**
       Events of interest are given in the formats:
       start, playerID, playerName,isHomeTeam,battingOrder,positionCode
       sub, playerID, playerName,isHomeTeam,battingOrder,positionCode
       play, inningNumber, batterIsHomeTeam, batterPlayerID,ballStrikeCount,pitchResultSequence,playResult
      **/
      if eventType in ("start", "sub") and col3 = "0" and col5 = "1" then do;                                     /* 1 */
         /** pitcher entering for away team **/
         pitcherAway = col1;
      end;
      else if eventType in ("start", "sub") and col3 = "1" and col5 = "1" then do;                                /* 2 */
         /** pitcher entering for home team **/
         pitcherHome = col1;
      end;
      else if eventType="play" then do;                                                                           /* 3 */
         batter=col3;

         if col2="0" then pitcher=pitcherHome;                                                                    /* 4 */
         else pitcher=pitcherAway;

         event = col6;
         if prxmatch(reHit, event) = 1 then do                                                                    /* 5 */
            outcome = 1;
            output;
         end;
         else if prxmatch(reNoHit, event) = 1 then do;                                                            /* 6 */
            outcome = 0;
            output;
         end;
      end;
   end;
   keep batter pitcher outcome event;                                                                             /* 7 */
run;

%mend loadYears; |
Aggregating the data
After producing a data set of hit/no-hit outcomes, you can aggregate these data to produce one observation per batter-pitcher pair. For example, you can aggregate the number of at bats "ab" and the batting average "avg". To limit the analysis to players in the 2019 playoffs, here is a roster data file. You can use this file to create a data set containing the 25-player active roster of each playoff team:
data playoffRosters; infile "rosters.txt"; input playerId $ team $; run; |
Next, the following macro aggregates batter-pitcher matchup data for a particular list of MLB players.
%macro dataPrep(outcomes, bvp, playerList);
%global nBatters nPitchers;

/* Aggregate per batter-pitcher pair */
proc sql;
   create table &bvp.Tmp as
   select batter, pitcher, sum(outcome)/count(outcome) as avg, count(outcome) as ab
   from &outcomes
   group by batter, pitcher;
quit;

/* Aggregate stats per batter and per pitcher. Keep only batters and pitchers in playerList. */
proc sql;
   create table battersTmp as
   select a.batter as batter,
          SUM(a.ab) as ab,
          SUM(a.avg*a.ab)/SUM(a.ab) as avg
   from &bvp.Tmp as a
   join &playerList as b
   on a.batter EQ b.playerid
   group by batter
   order by ab desc
   ;
quit;
proc sql;
   create table pitchersTmp as
   select a.pitcher,
          SUM(a.ab) as ab,
          SUM(a.avg*a.ab)/SUM(a.ab) as avg
   from &bvp.Tmp as a
   join &playerList as b
   on a.pitcher EQ b.playerid
   group by pitcher
   order by ab desc
   ;
quit;

/* Join together */
proc sql;
   create table &bvp as
   select a.*,
          b.ab as batter_ab,
          b.avg as batter_avg,
          c.ab as pitcher_ab,
          c.avg as pitcher_avg
   from &bvp.Tmp a
   join battersTmp b
   on a.batter = b.batter
   join pitchersTmp c
   on a.pitcher = c.pitcher
   ;
   select count (distinct batter) into :nBatters
   from &bvp;
   select count (distinct pitcher) into :nPitchers
   from &bvp;
quit;

proc sql;
   drop table battersTmp;
   drop table pitchersTmp;
   drop table &bvp.Tmp;
quit;
%mend dataPrep; |
Taking a quick look into the data
Now, for the analysis: you can invoke the macros
%let LEAGUE=MLB; %loadYears(2010, 2018, outcomes, LEAGUE=&LEAGUE); %dataPrep(outcomes, bvp, playoffRosters); |
and inspect the data
proc sort data=bvp; by descending ab; run; proc print data=bvp (obs=3); run; |
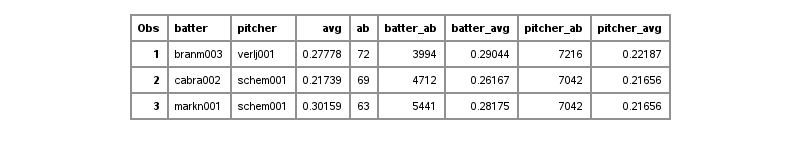
This indicates that the batter-pitcher pairs with the most at bats from 2010 to 2018 are Michael Brantley (branm003) against Justin Verlander (verlj001), Asdrubal Cabrera (cabra002) against Max Scherzer (schem001), and Nick Markakis (markn001) against Max Scherzer (schem001).
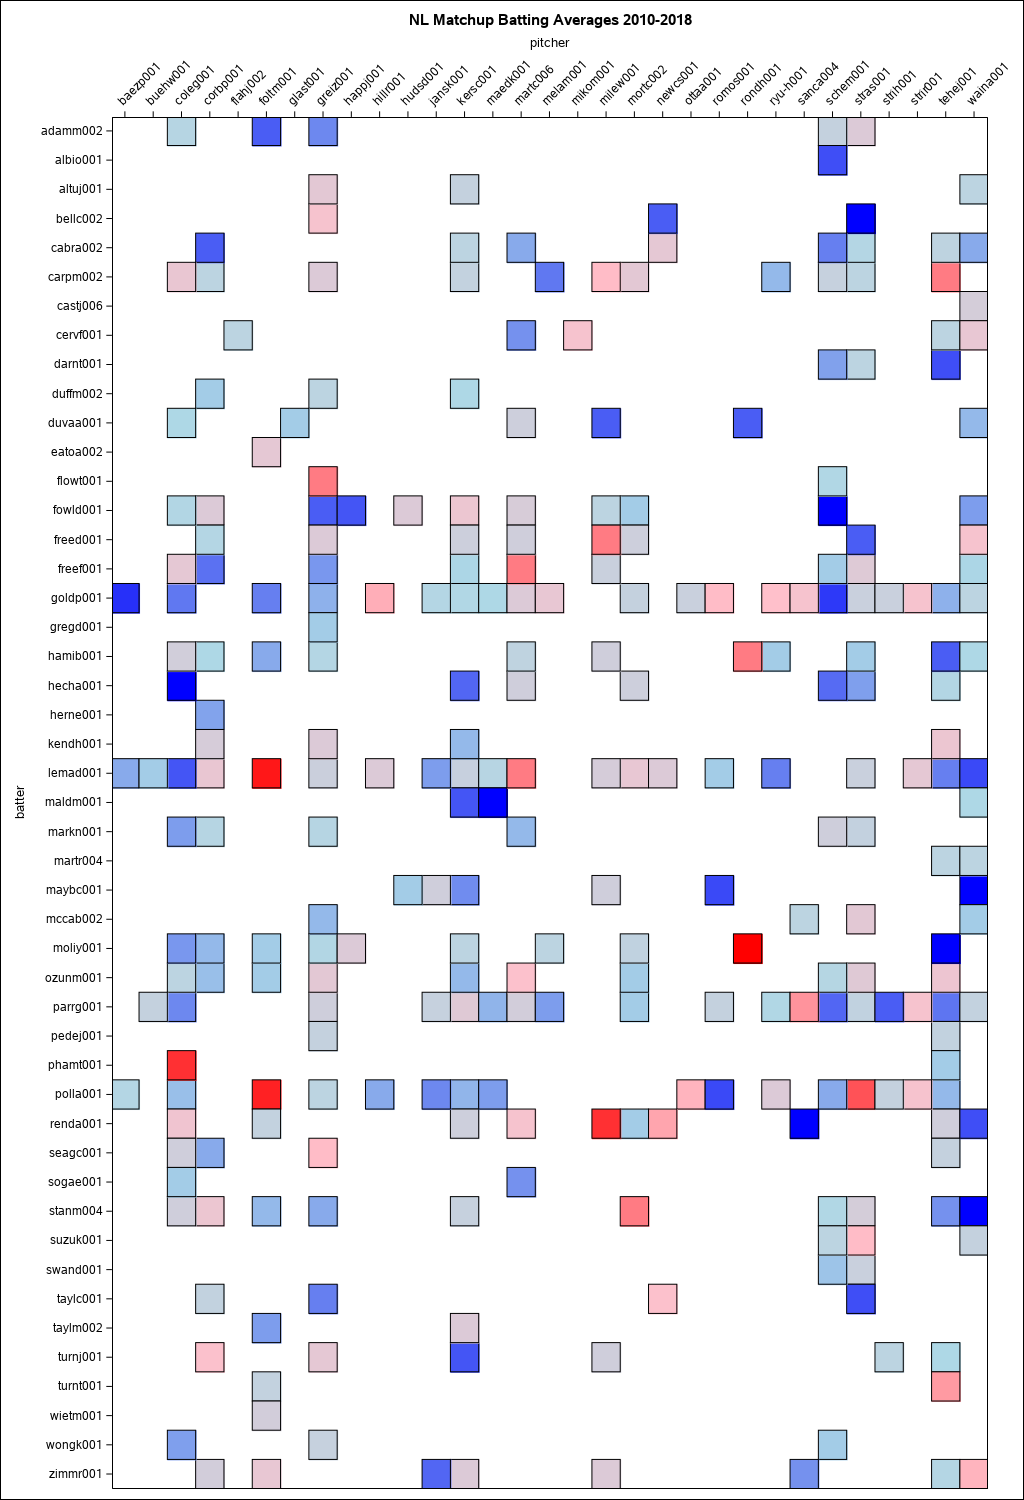
Next, you can use the following statements to see all the historical batting averages of the key batter-pitcher matchups. To avoid noise from tiny sample sets, you can filter out matchups with fewer than 10 at bats. In the generated heat map visualization, red corresponds to higher batting average and blue corresponds to lower batting average. Since the National League and American League teams play each other infrequently, it is helpful to show them one at a time. Here are the National League matchups:
%let LEAGUE=NL;
%loadYears(2010, 2018, outcomes, LEAGUE=&LEAGUE);
%dataPrep(outcomes, bvp, playoffRosters);
proc sgplot data=bvp(where=(ab GE 10)) noautolegend;
   title "&LEAGUE Matchup Batting Averages 2010-2018";
   heatmap y=batter x=pitcher / weight=avg
      colormodel=(blue lightBlue pink red) outline x2axis;
   xaxis display=none;
   x2axis display=ALL;
   yaxis display=ALL reverse;
run; |
and the American League matchups:
%let LEAGUE=AL;
%loadYears(2010, 2018, outcomes, LEAGUE=&LEAGUE);
%dataPrep(outcomes, bvp, playoffRosters);
proc sgplot data=bvp(where=(ab GE 10)) noautolegend;
   title "&LEAGUE Matchup Batting Averages 2010-2018";
   heatmap y=batter x=pitcher / weight=avg
      colormodel=(blue lightBlue pink red) outline x2axis;
   xaxis display=none;
   x2axis display=ALL;
   yaxis display=ALL reverse;
run; |
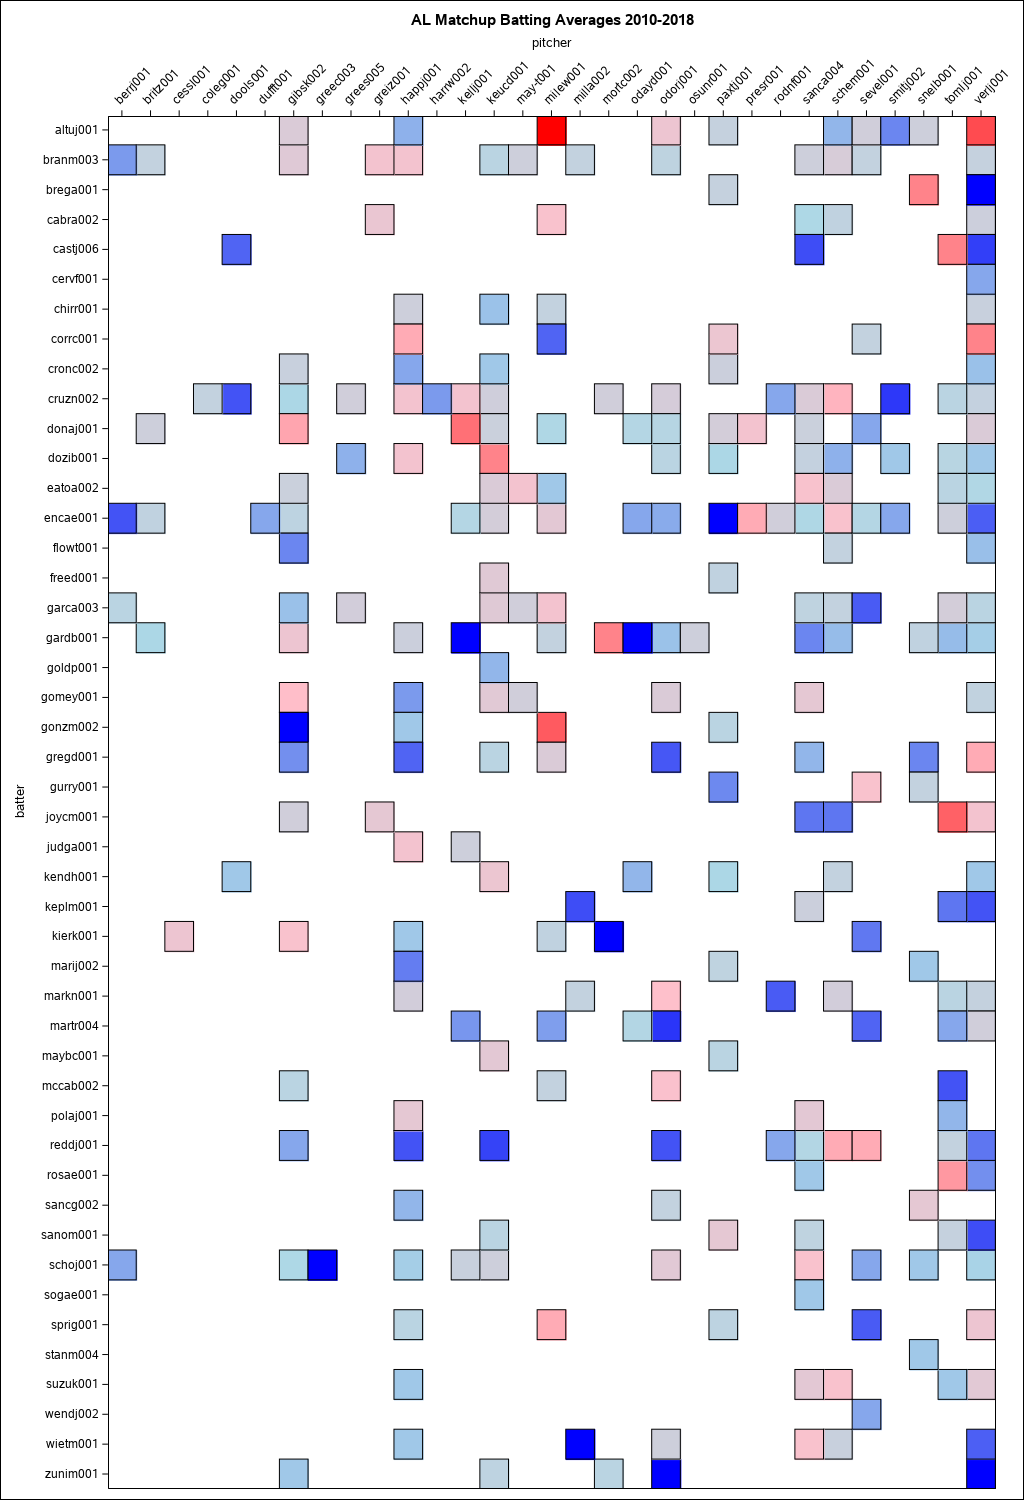
Noteworthy matchups from the heat maps include:
- Anthony Rendon (renda001) has a .583 batting average in 12 at bats against Wade Miley (milew001)
- Paul Goldschmidt (goldp001) has a .048 batting average in 21 at bats against Pedro Baez (baezp001)
- Alex Bregman (brega001) has a .500 batting average in 10 at bats against Blake Snell (snelb001)
- Yuli Gurriel (gurry001) has a .136 batting average in 10 at bats against James Paxton (paxtj001)
So, how have these actually panned out? Alex Bregman faced Blake Snell in game 2 of the ALDS. Bregman had 1 hit in 2 at bats including a home run off Snell! Goldschmidt never got to face Baez, as the Dodgers didn't make it out of the NLDS. Yuli Gurriel was hitless in 4 at bats against James Paxton in the ALCS. Anthony Rendon won't get to face Wade Miley since the Astros have not included Miley on the World Series roster.
Coming up next
Baseball managers have often criticized batter-pitcher matchup data because of their poor predictive power. This is typically due to very small sample sizes. In a future post, I will analyze this data using collaborative filtering, a machine learning technique that will help address the problem of small sample sizes. From there, I will explore ways to optimally choose a lineup of batters to face a particular pitcher. On an introductory level, this series of posts will demonstrate an end-to-end approach to lineup optimization.