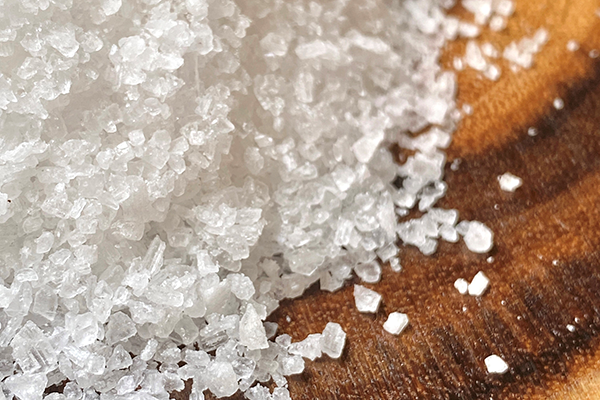
How to draw a swimmer plot in SAS Visual Analytics
SAS' Cindy Wang shows you how to create a swimmer plot using SAS Visual Analytics.
SAS is excited to announce our inaugural Customer Appreciation Awards. We want to give a big “thank you” and a round of applause to all our SAS customers and partners around the globe who help us change the world through analytics. We want to recognize a few of you for
It was the summer of ’22. And in the words of Taylor Swift, “I remember it all too well” (Taylor’s version, of course). From mentoring opportunities, networking with top leaders and other interns, exploring our culture that promotes well-being and work-life integration to having meaningful work to gain real world