Friday's Innovation Inspiration - Parsing for 100% comparison

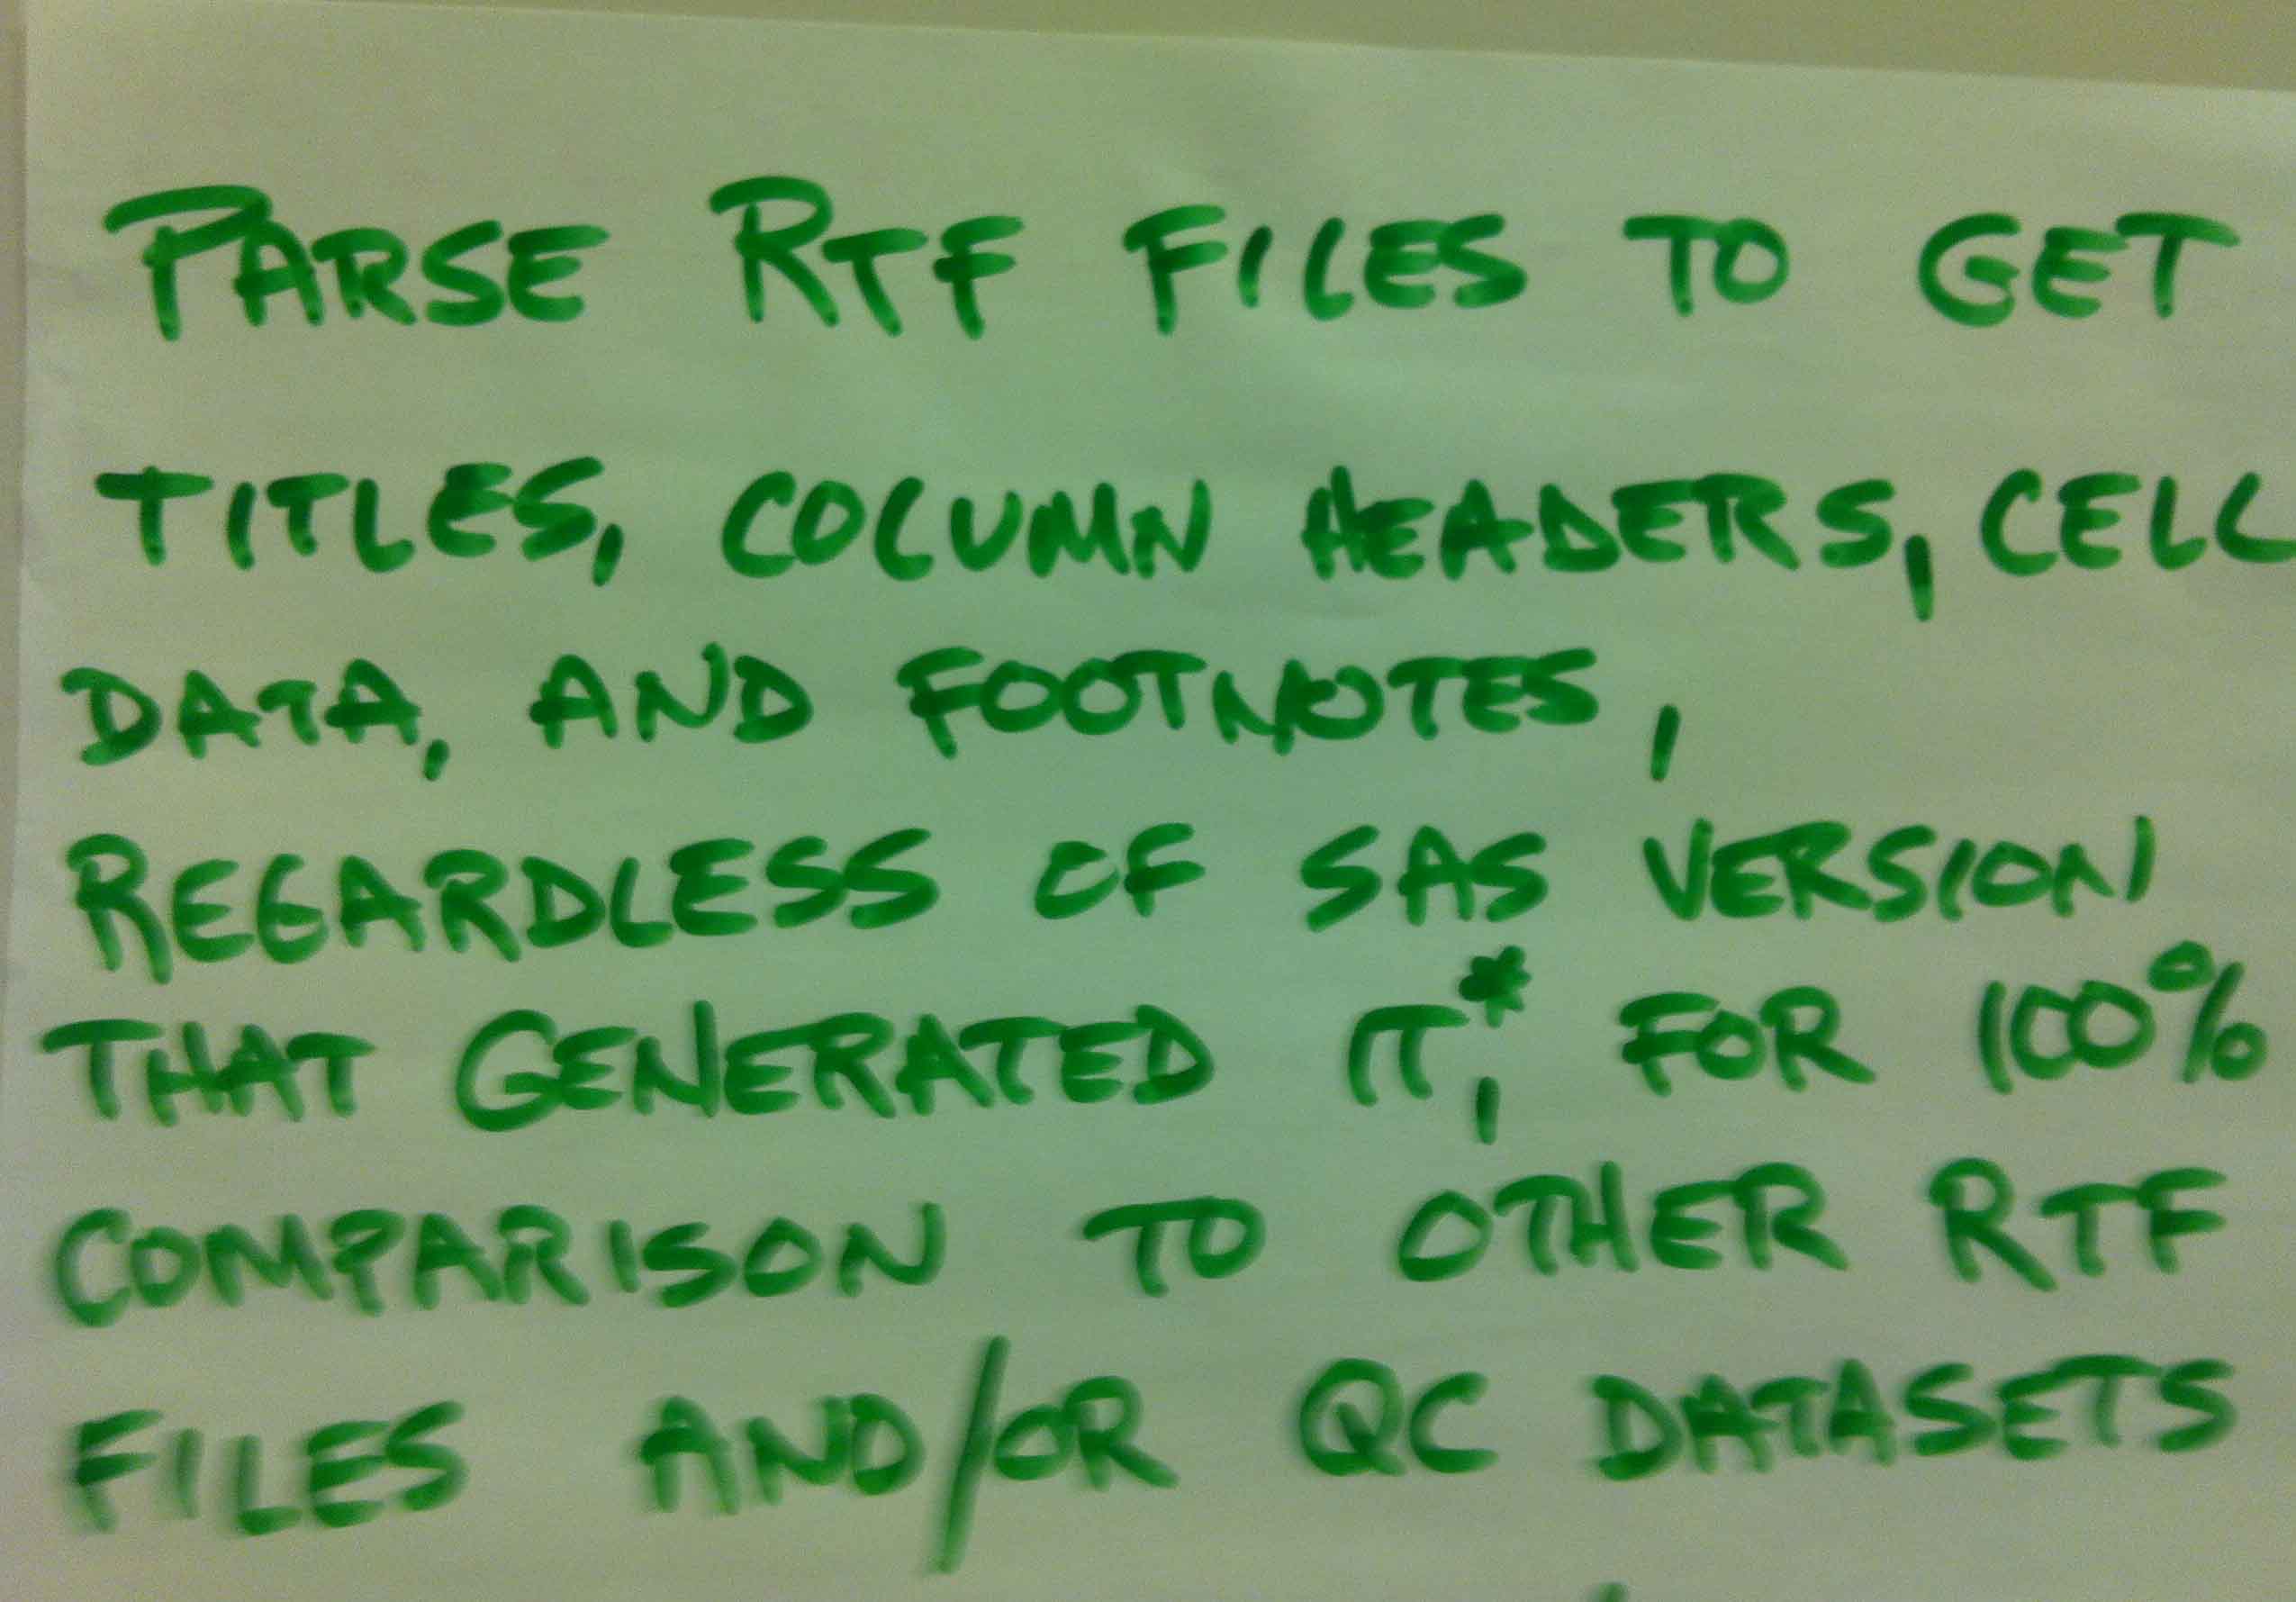
Did I tell you that I went to Andrew Kuligowski's hands-on workshop while I was at MWSUG 2012? Actually, I only attended the first portion of his session; it didn't make sense for me to take up a computer since I'm not a programmer. His workshop was to teach users how to parse useful data from unusual