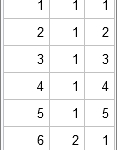
If you write an n x p matrix from PROC IML to a SAS data set, you'll get a data set with n rows and p columns. For some applications, it is more convenient to write the matrix in a "long format" with np observations and three columns. The first
In recent conversations with many SAS users at NESUG, SESUG and WUSS, a pattern emerges on the question of creating graphs with SAS or R. Many SAS users are aware of the new graph features in SAS that create high quality graphs with minimum fuss. But, many have not actually used
Are you in the market for a new car? Perhaps you are researching how the various parameters of cars match up to each other? Well, in SAS 9.4 Maintenance 1 release, ODS Graphics will support a new versatile plot: the polygon plot. As the name suggests, it lets you draw