English

Rick Wicklin 0
Create discrete heat maps in SAS/IML

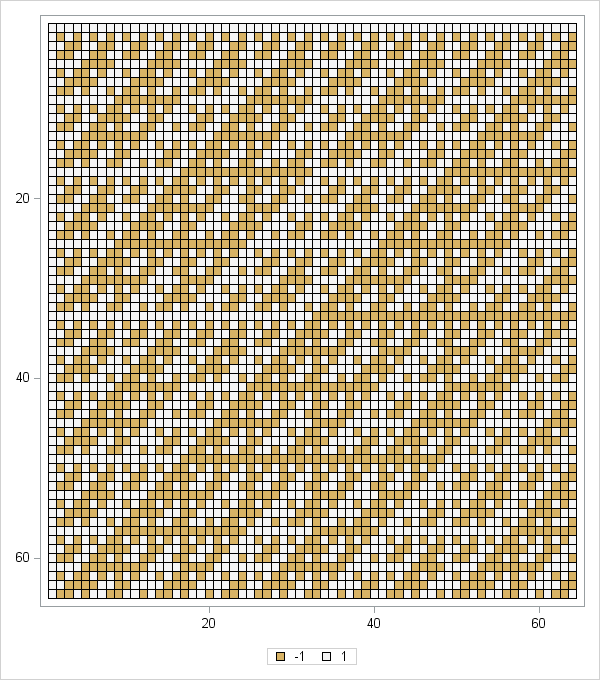
In a previous article I introduced the HEATMAPCONT subroutine in SAS/IML 13.1, which makes it easy to visualize matrices by using heat maps with continuous color ramps. This article introduces a companion subroutine. The HEATMAPDISC subroutine, which also requires SAS/IML 13.1, is designed to visualize matrices that have a small

Data Visualization
Sanjay Matange 0
CandleStick Chart

A HighLow plot is very popular in the financial industry, often used to track the periodic movement of a stock or some instrument or commodity.  The CandleStick Chart is one specific type of high low plot, purportedly originating in Japan for tracking of financial instruments in the rice trade. Creating a