Can big data and bad administration coexist?

.@philsimon on an important question.
.@philsimon on an important question.
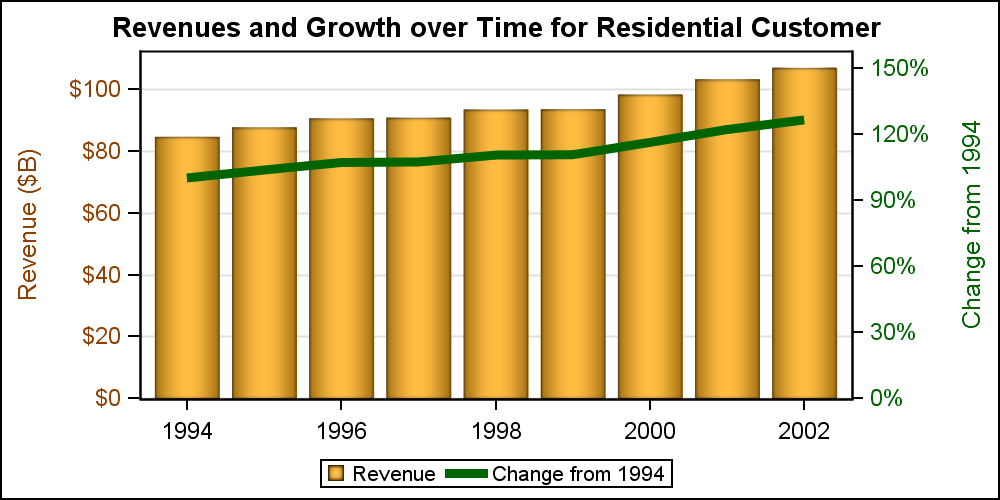
Often we need graphs that display two or more responses by the same category values. In many cases it is useful to plot both responses on the same response (Y) axis. This can be helpful to understand the data and compare the magnitudes side by side. This works when the scales
For a long time, master data management (MDM) practitioners boasted about their ability to build a 360° view of customers by aggregating and proactively managing information coming from various business applications such as CRM systems, ERP applications, and other operational systems. But was it really a 360° view? What about