With so many options in the sea of protein supplements from protein and collagen powders to protein bars and premade protein shakes, it can be very overwhelming knowing what to pick. Below are the results from my premade protein shake search.

With so many options in the sea of protein supplements from protein and collagen powders to protein bars and premade protein shakes, it can be very overwhelming knowing what to pick. Below are the results from my premade protein shake search.

SAS inventors recently gathered to celebrate the 2023 patent honorees. The dinner event marked 20 years of the annual celebration and featured photos and memories from years past. SAS Senior Principal Patent Counsel Dwight Thompson offered opening remarks at The Umstead Hotel banquet in Cary, which he said was designed

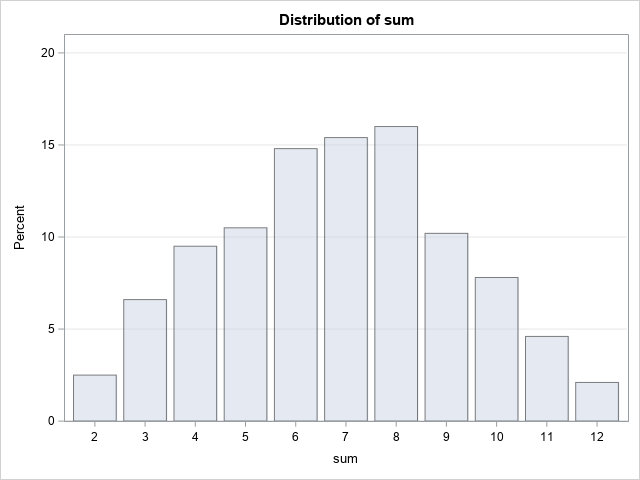
At a recent conference in Las Vegas, a presenter simulated the sum of two dice and used it to simulate the game of craps. I write a lot of simulations, so I'd like to discuss two related topics: How to simulate the sum of two dice in SAS. This is