English

Data Visualization
Sanjay Matange 0
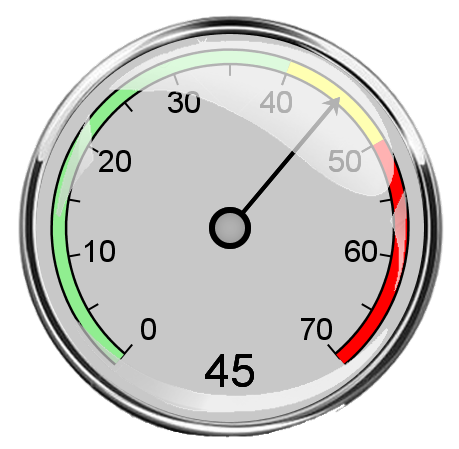
Dial KPI using SGPLOT

Last week I was at PharmaSUG 2016, where I presented a 1/2 day seminar on creating Clinical Graphs using SAS.  I was gratified to have a enthusiastic audience of about 28 attendees and we had a great interactive session.  I also presented a paper on Clinical Graphs Using SAS.  More

Data Management | Programming Tips
Mary Kathryn Queen 0
Improving matching results in DataFlux Data Management Studio with cluster comparison

Trusted data is key to driving accurate reporting and analysis, and ultimately, making the right decision. SAS Data Quality and SAS Data Management are two offerings that help create a trusted, blended view of your data. Both contain DataFlux Data Management Studio, a key component in profiling, enriching monitoring, governing

Internet of Things
David Pope 0
An IoT-enabled fun weekend

The buzz about the Internet of Things (IoT) combined with the insights derived from analytics appears to be hotter than ever.  What's interesting to me is how many people go about their lives without knowing what the IoT is and how they're already benefitting from it (or how their jobs