English

Advanced Analytics | SAS Administrators
David Stern 0
Creating and uploading custom icons and map pin icons in SAS® Visual Investigator

SAS Visual Investigator has an attractive user interface. One of its most engaging features is the network diagram, which represents related ‘entities’ and the connections between them, allowing an investigator to see and explore relationships in their source data. For maximum impact, each entity in the network diagram should have an
Data Visualization | Learn SAS | Programming Tips
Sanjay Matange 0
Legend order redux

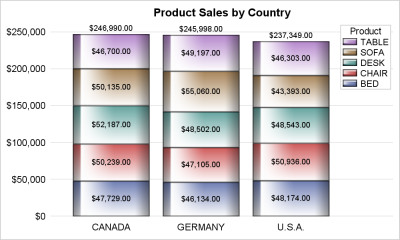
Once in a while you run into a pesky situation that is hard to overcome without resorting to major surgery.  Such a situation occurs when you have a stacked bar chart with a discrete legend positioned vertically on the side of the graph.  A simple example is shown below. title