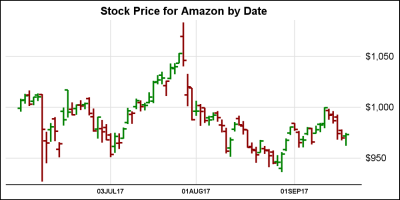
English

Data Visualization
Sanjay Matange 0
Stock chart

In the previous article on Getting Started with Vertical HighLow Plot, I described how we can use the HighLow plot to display the stock price by date.  The HighLow plot is specifically designed for such use cases as shown below. The data is downloaded from the Nasdaq web site, and

Advanced Analytics | Machine Learning
Charlie Chase 0
Is demand sensing and shaping a key component of your company’s digital supply chain transformation?

Depending on who you speak with you will get varying definitions and opinions regarding demand sensing and shaping from sensing short-range replenishment based on sales orders to manual blending of point-of-sales (POS) data and shipments.        Most companies think that they are sensing demand when in fact they are