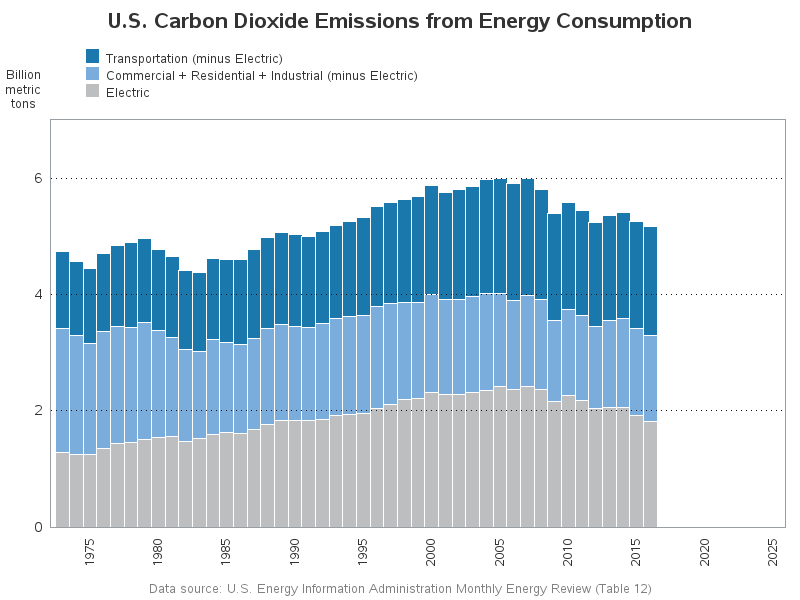
Manufacturing

Data Visualization | Learn SAS | Programming Tips
Sanjay Matange 0
Spark table

In the previous post, I discussed creating a 2D grid of spark lines by Year and Claim Type.  This graph was presented in the SESUG conference held last week on SAS campus in the paper ""Methods for creating Sparklines using SAS" by Rick Andrews.  This grid of sparklines was actually the

Data Visualization | Learn SAS | Programming Tips
Sanjay Matange 0
Spark grid

The 25th annual SESUG conference was held at in the SAS campus this week.  I had the opportunity to meet and chat with many users and attend many excellent presentations.  I will write about those that stood out (graphically) in my view. One excellent presentation was on "Methods for creating

Advanced Analytics | Analytics
Christian Goßler 0
Lenin und der Rote Rapper im Internet of Ticks (IoT5)

„… Internet, Internet, ich hör‘ hier immer Internet. Sag’n Se‘ ma‘, ganz richtig ist das nicht!“ Der Service-Manager errötet nach seinem Rap. Lenin schwankt zwischen Belustigung und bolschewistischem Ingrimm: Stellt der Rote Rapper seine Erfolge im Internet of Things infrage? Der Rapper fährt fort: „Denn diese Daten, die Sie verbraten,

1 75 76 77 78 79 124