Tips and tricks - Multiple blank categories on axis

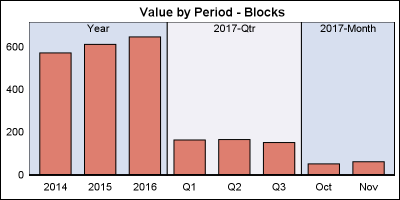
Off and on, users have expressed the need to include multiple blank categories on a discrete axis. Often, this is desirable to separate groups of bars (or categories) in a graph due to some difference their definition. Such a case was discussed in this blog article on using non breaking