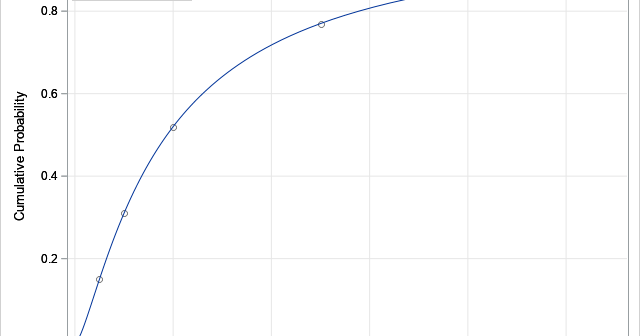
The metalog family of distributions (Keelin, Decision Analysis, 2016) is a flexible family that can model a wide range of continuous univariate data distributions when the data-generating mechanism is unknown. This article provides an overview of the metalog distributions. A subsequent article shows how to download and use a library
Tag: Data Analysis
A SAS programmer was trying to simulate poker hands. He was having difficulty because the sampling scheme for simulating card games requires that you sample without replacement for each hand. In statistics, this is called "simple random sampling." If done properly, it is straightforward to simulate poker hands in SAS.
A profile plot is a way to display multivariate values for many subjects. The optimal linear profile plot was introduced by John Hartigan in his book Clustering Algorithms (1975). In Michael Friendly's book (SAS System for Statistical Graphics, 1991), Friendly shows how to construct an optimal linear profile by using
A profile plot is a compact way to visualize many variables for a set of subjects. It enables you to investigate which subjects are similar to or different from other subjects. Visually, a profile plot can take many forms. This article shows several profile plots: a line plot of the
The area of a convex hull enables you to estimate the area of a compact region from a set of discrete observations. For example, a biologist might have multiple sightings of a wolf pack and want to use the convex hull to estimate the area of the wolves' territory. A
A common question on SAS discussion forums is how to use SAS to generate random ID values. The use case is to generate a set of random strings to assign to patients in a clinical study. If you assign each patient a unique ID and delete the patients' names, you
Monotonic transformations occur frequently in math and statistics. Analysts use monotonic transformations to transform variable values, with Tukey's ladder of transformations and the Box-Cox transformations being familiar examples. Monotonic distributions figure prominently in probability theory because the cumulative distribution is a monotonic increasing function. For a continuous distribution that is
A SAS customer asked how to use the Box-Cox transformation to normalize a single variable. Recall that a normalizing transformation is a function that attempts to convert a set of data to be as nearly normal as possible. For positive-valued data, introductory statistics courses often mention the log transformation or
In the 1960s and '70s, before nonparametric regression methods became widely available, it was common to apply a nonlinear transformation to the dependent variable before fitting a linear regression model. This is still done today, with the most common transformation being a logarithmic transformation of the dependent variable, which fits
John Tukey was an influential statistician who proposed many statistical concepts. In the 1960s and 70s, he was fundamental in the discovery and exposition of robust statistical methods, and he was an ardent proponent of exploratory data analysis (EDA). In his 1977 book, Exploratory Data Analysis, he discussed a small