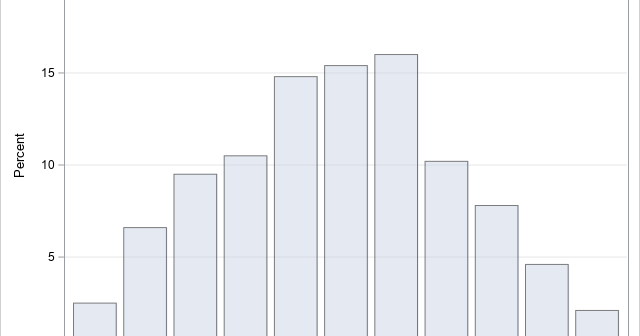
At a recent conference in Las Vegas, a presenter simulated the sum of two dice and used it to simulate the game of craps. I write a lot of simulations, so I'd like to discuss two related topics: How to simulate the sum of two dice in SAS. This is

At a recent conference in Las Vegas, a presenter simulated the sum of two dice and used it to simulate the game of craps. I write a lot of simulations, so I'd like to discuss two related topics: How to simulate the sum of two dice in SAS. This is
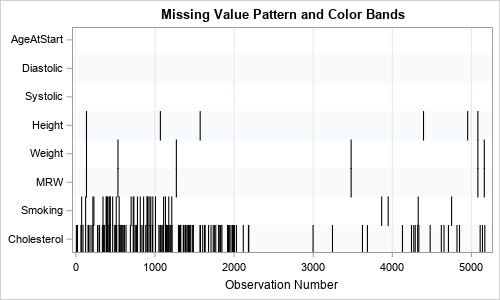
Years ago, I wrote an article that showed how to visualize patterns of missing data. During a recent data visualization talk, I discussed the program, which used a small number of SAS IML statements. An audience member asked whether it is possible to construct the same visualization by using only
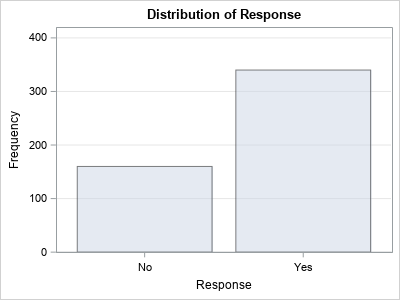
A SAS programmer wanted to estimate a proportion and a confidence interval (CI), but didn't know which SAS procedure to call. He knows a formula for the CI from an elementary statistics textbook. If x is the observed count of events in a random sample of size n, then the
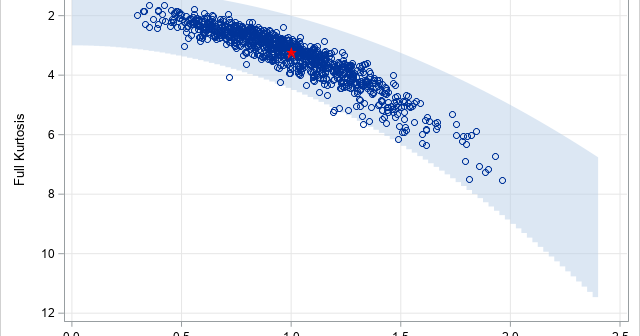
The moment-ratio diagram is a tool that is useful when choosing a distribution that models a sample of univariate data. As I show in my book (Simulating Data with SAS, Wicklin, 2013), you first plot the skewness and kurtosis of the sample on the moment-ratio diagram to see what common
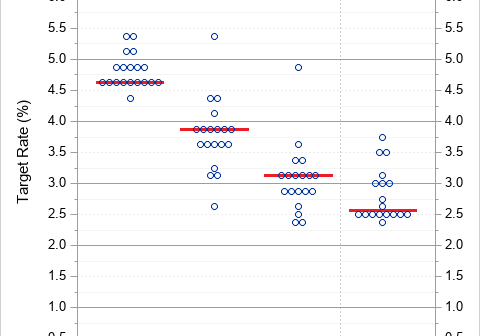
A dot plot is a standard statistical graphic that displays a statistic (often a mean) and the uncertainty of the statistic for one or more groups. Statisticians and data scientists use it in the analysis of group data. In late 2023, I started noticing headlines about "dot plots" in the
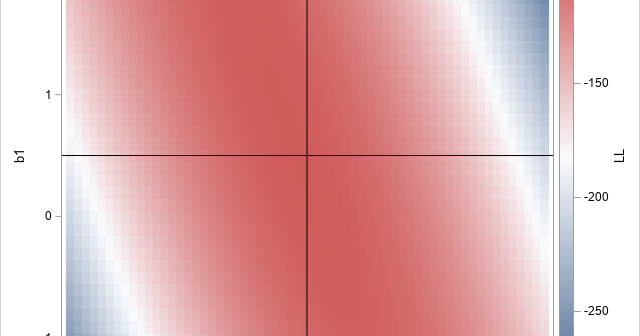
A statistical analyst used the GENMOD procedure in SAS to fit a linear regression model. He noticed that the table of parameter estimates has an extra row (labeled "Scale") that is not a regression coefficient. The "scale parameter" is not part of the parameter estimates table produced by PROC REG
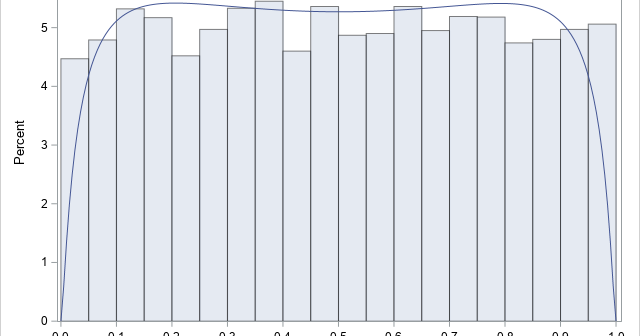
With four parameters I can fit an elephant. With five I can make his trunk wiggle. — John von Neumann Ever since the dawn of statistics, researchers have searched for the Holy Grail of statistical modeling. Namely, a flexible distribution that can model any continuous univariate data. As the quote
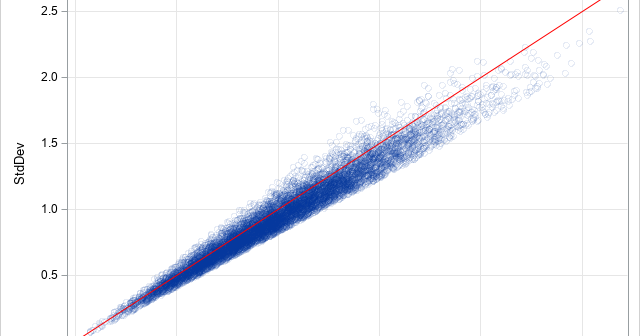
In statistical quality control, practitioners often estimate the variability of products that are being produced in a manufacturing plant. It is important to estimate the variability as soon as possible, which means trying to obtain an estimate from a small sample. Samples of size five or less are not uncommon
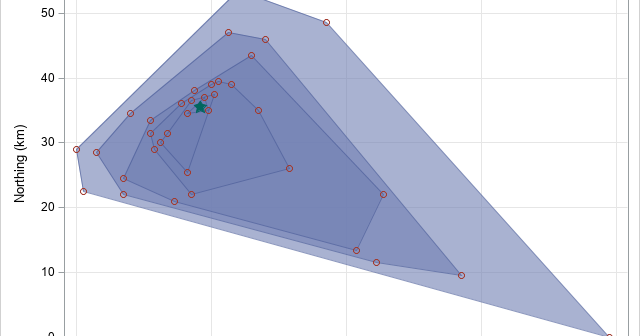
This article looks at a geometric method for estimating the center of a multivariate point cloud. The method is known as convex-hull peeling. In two-dimensions, you can perform convex-hull peeling in SAS 9 by using the CVEXHULL function in SAS IML software. For higher dimensions, you can use the CONVEXHULL
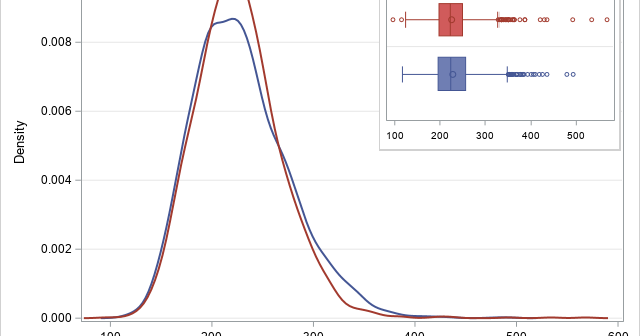
In a previous article, I presented some of the most popular blog posts from 2023. The popular articles tend to discuss elementary topics that have broad appeal. However, I also wrote many technical articles about advanced topics. The following articles didn't make the Top 10 list, but they deserve a