Many SAS procedures support a BY statement that enables you to perform an analysis for each unique value of a BY-group variable. The SAS IML language does not support a BY statement, but you can program a loop that iterates over all BY groups. You can emulate BY-group processing by
Tag: Data Analysis
There are many ways to model a set of raw data by using a continuous probability distribution. It can be challenging, however, to choose the distribution that best models the data. Are the data normal? Lognormal? Is there a theoretical reason to prefer one distribution over another? The SAS has
Does anyone write paper checks anymore? According to researchers at the Federal Reserve Bank of Atlanta (Greene, et al., 2020), the use of paper checks has declined 63% among US consumers since the year 2000. The researchers surveyed more than 3,000 consumers in 2017-2018 and discovered that only 7% of
In a previous article, I discussed the Wilcoxon signed rank test, which is a nonparametric test for the location of the median. The Wikipedia article about the signed rank test mentions a variation of the test due to Pratt (1959). Whereas the standard Wilcoxon test excludes values that equal μ0
Wilcoxon's signed rank test is a popular nonparametric alternative to a paired t test. In a paired t test, you analyze measurements for subjects before and after some treatment or intervention. You analyze the difference in the measurements for each subject, and test whether the mean difference is significantly different
A previous article discusses standardized coefficients in linear regression models and shows how to compute standardized regression coefficients in SAS by using the STB option on the MODEL statement in PROC REG. It also discusses how to interpret a standardized regression coefficient. Recently, a SAS user wanted to know how
A previous article explains the Spearman rank correlation, which is a robust cousin to the more familiar Pearson correlation. I've also discussed why you might want to use rank correlation, and how to interpret the strength of a rank correlation. This article gives a short example that helps you to
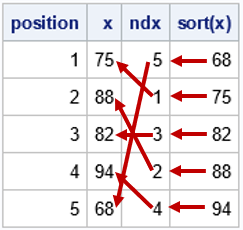
SAS supports many ways to compute the rank of a numeric variable and to handle tied values. However, sometimes I need to rank the values in a character categorical variable. For example, the values {"Male", "Female", "Male"} have ranks {2, 1, 2} because, in alphabetical order, "Female" is the first-ranked
A previous article defines the silhouette statistic (Rousseeuw, 1987) and shows how to use it to identify observations in a cluster analysis that are potentially misclassified. The article provides many graphs, including the silhouette plot, which is a bar chart or histogram that displays the distribution of the silhouette statistic
Assigning observations into clusters can be challenging. One challenge is deciding how many clusters are in the data. Another is identifying which observations are potentially misclassified because they are on the boundary between two different clusters. Ralph Abbey's 2019 paper ("How to Evaluate Different Clustering Results") is a good way