Correlation is a statistic that measures the association between two variables. When two variables are positively correlated, low values of one variable tend to be associated with low values of the other variable. Medium values and high values are similarly associated. For negative correlation, the association is flipped: low values of one variable tend to be associated with high values of the other variable. Because the variables might have different scales, the correlation statistic standardizes the variables and reports the association between the standardized variables. From the preceding description, it is apparent that a correlation applies to variables whose values can be ranked from low to high. The most popular familiar correlation statistic (Pearson's product moment statistic) applies only to continuous numeric variables, which are also called interval variables.
However, there is also a correlation statistic that you can use for two discrete ordinal variables. It is called the polychoric correlation. The polychoric correlation applies to any ordinal variable, including character variables with measurements levels such as "low", "medium", and "high". This article discusses polychoric correlation: when you should you use it, how you can interpret it, and how you can compute it in SAS.
Ordinal variables
The polychoric correlation is used to report associations between discrete ordinal variables. Ordinal variables naturally occur in two ways:
- Binning a continuous variable. For example, a teacher can assign a student a letter grade (A, B, C, D, F) by binning the student's scores from assignments and tests. The letter grade is an ordinal variable because there is an order A > B > C > D > F. Notice that the ordinal variable is based on an underlying continuous variable, but the value of the continuous variable is unknown to someone reading the student's transcript.
- Answering a questionnaire: A common format for a questionnaire is to solicit responses on a Likert scale. A Likert item might have three, four, five, or more response categories. For example, the subject might be asked to respond to the statement, "this course increased my interest in the subject," and be required to choose from among the responses "Disagree", "Neutral", and "Agree". Although it is not always mentioned, this kind of response is also based on an underlying, unobserved, continuous variable, which is the degree to which the responder agrees with the statement. A student who vehemently hated the course and a student who slightly disliked the course might both response "Disagree." In that sense, the ordinal responses are a discretization of an underlying continuous variable.
Polychoric correlation assumes that an ordinal response is a discretization of an underlying continuous variable.
What is polychoric correlation?
Polychoric correlation estimates the Pearson correlation between two continuous variables that underlie the ordinal variables. As mentioned in the previous section, an ordinal variable, Y, can be thought of as a discretization (or binning) of an underlying unobserved continuous variable, X. The unobserved variable is called a latent variable. Even if the ordinal variables are character variables, the underlying variables are numeric, which means that they can be standardized.
Polychoric correlation assumes that the latent variables are bivariate normal with correlation ρ. The polychoric correlation is defined as the estimate of ρ. That is, when we say that the polychoric correlation between two ordinal variables, Y1 and Y2, is r, it means that r is an estimate for the Pearson correlation between two latent variables, X1 and X2, that are bivariate normal and that are inferred from Y1 and Y2.
If this sounds challenging, fear not! Most statistical software provides build-in support for estimating the polychoric correlation. For example, in SAS, you can use the FREQ procedure or the CORR procedure in Base SAS. Polychoric correlation is also included in the IRT procedure in SAS/STAT software. The next section shows an example of how to estimate the polychoric correlation in SAS.
Polychoric correlation in SAS
Let's look at an example of polychoric correlation. The provider of an online programming course thinks there is an association between how students perform in a course (their "grade") versus how they rate the quality of the course. They suspect that students who fail the course tend to rate the course poorly, whereas students who had high scores tend to rate the course favorably. polychoric correlation is one way to estimate the strength of the association between these two variables.
The provider randomly selects the records of 2,000 students who finished the course. They classify each student's performance into three categories ("Low", "Medium", and "High") according to the student's scores for online assessments during the course. The provider calls this the Performance variable.
Each student responded to an end-of-course questionnaire, so the provider has the student's response to the statement, "I would recommend this course to others who want to learn the subject." The students chose from four possible responses: "Strongly Disagree", "Disagree", "Agree", and "Strongly Agree". The provider decides to use the student's response on this question as a proxy for whether the student rated the course as low quality or high quality. This is the Quality variable.
The following DATA step creates the Performance and Quality variables for 2,000 students. Notice that the variables are defined as numeric variables, and a SAS format is used to display the character values. This is a good way to encode ordinal variables because SAS procedures will use the numeric order of the variables to display the data in tables and graphs:
/* Encode the ordinal variables as 1,2,...,k. Use a SAS format to display the class levels. */ proc format; value QualFmt 1="Strongly Disagree" 2="Disagree" 3="Agree" 4="Strongly Agree"; value PerfFmt 1="Low" 2="Medium" 3="High"; run; data Agree; format Quality QualFmt. Performance PerfFmt.; input Quality Performance Count @@; label Quality="Quality Course?" Performance="Performance on Tests"; datalines; 1 1 131 1 2 71 1 3 20 2 1 217 2 2 207 2 3 112 3 1 213 3 2 337 3 3 257 4 1 52 4 2 139 4 3 244 ; |
You can use PROC FREQ to analyze the association between these two variables. The PLCORR option requests the polychoric correlation between the Performance and Quality variables. The CL option provides standard errors and confidence intervals for the measures of association:
proc freq data=Agree; tables Quality * Performance / PLCORR CL norow nocol nopercent; weight Count; run; |
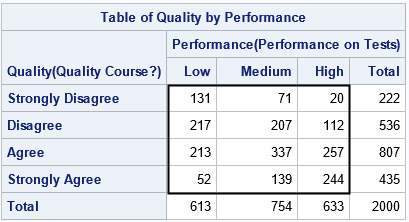
The output shows the frequencies for the 4 x 3 table that cross-tabulates the students' performance with their views concerning the quality of the course. I added a rectangle to emphasize the 12 frequencies because the table also shows the marginal totals for each variable. From the table, you can observe a few facts:
- Of the 222 students who did not like the course ("Strongly disagree"), 131 (59%) performed poorly on tests. Only 20 students (9%) were high-performing students.
- Of the 435 students who liked the course the most ("Strongly agree"), only 52 (12%) performed poorly on tests. A majority of 244 students (56%) were high-performing.
These counts seem to imply that there is an association between a student's performance and how highly he or she rates the course. PROC FREQ displays many statistical measures of association. The polychoric correlation appears in the middle of the following list of statistics:
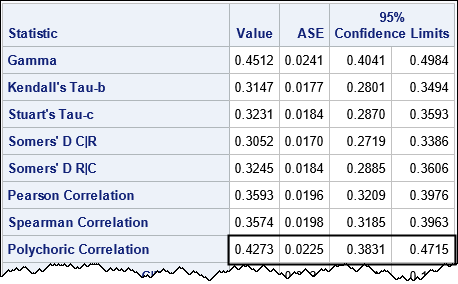
The polychoric correlation between the Performance and the Quality variables is 0.427 for this example. (The table also displays a standard error and 95% confidence interval for the correlation.) The course provider concludes that there is a moderate positive association between a student's performance in the course and whether he or she is likely to recommend the course to others.
Interpretation of the polychoric correlation
Recall that the polychoric correlation is an estimate of the correlation between bivariate normal latent variables. That is, we assume that the students' performance and their rating of the course are correlated bivariate normal variables. The estimate of the correlation between the latent variables is 0.427. The observed values are a discretization of the underlying latent variables.
Let's try to understand this by visualizing a hypothetical set of correlated bivariate normal variables, which are then binned. Study the following graph:
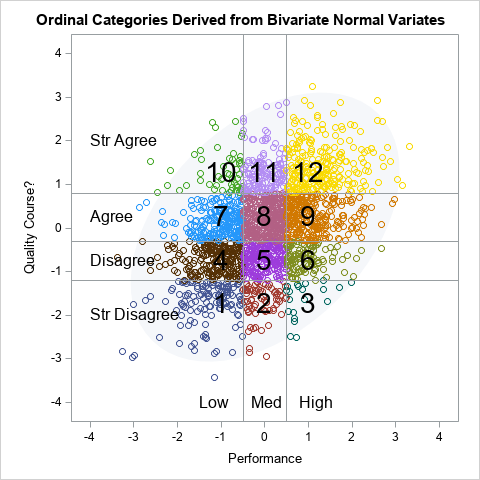
The graph is a hypothetical illustration of the relationship between the observed ordinal variables and the unobserved latent variables. We assume that the underlying continuous variables are bivariate normal and are correlated with ρ ≈ 0.427. We assume that the ordinal variable are created by binning the continuous variables at unknown locations. For example, in the figure, the Performance variable is obtained from the continuous X1 variable by using -0.5 and 0.5 as cut points. The Quality variable is obtained from the continuous X2 variable by using -1.2, -0.3, and 0.8 as cut points.
The cut points divide the plane into 12 rectangular regions, which correspond to the 12 cells of the frequency table for the ordinal variables. In the picture, there are 2,000 markers:
- 131 markers are in the region Performance="Low" and Quality="Strongly Disagree".
- 71 markers are in the region Performance="Medium" and Quality="Strongly Disagree".
- ... nine other regions ...
- 244 markers are in the region Performance="High" and Quality="Strongly Agree".
These counts are the same as the frequency counts for the cells in the PROC FREQ output. In this way, the latent continuous variables generate the ordinal variables and the association between them.
Another way to estimate polychoric correlation in SAS
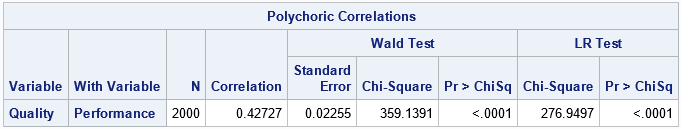
PROC FREQ can analyze either numeric or character variables. If the variables are numeric, you can also estimate the polychoric correlation by using PROC CORR. Typically, we assume that the variables in PROC CORR are assumed to be continuous. However, if you use the POLYCHORIC option, the procedure will estimate the correlation for the latent variables that are associated with the specified ordinal variables, as follows:
proc corr data=Agree polychoric; var Quality Performance; freq Count; run; |
Tetrachoric correlation
If both ordinal variables have two levels, then the polychoric correlation is called the tetrachoric correlation. That is, tetrachoric correlation is used a analyze a 2 x 2 table of frequency count. To remember this, recall that the prefix tetra- means "four" and a 2 x 2 table has four cells.
Summary
This article discusses polychoric correlation: when you should you use it, how you can interpret it, and how you can compute it in SAS. Polychoric correlation is a measure of association that applies to discrete ordinal variables. It is often used to analyze the association between variables with measurements levels such as "low", "medium", and "high". You can use it to examine the association between items on a Likert scale. This article shows a graph that illustrates the assumption of polychoric correlation. Namely, that the ordinal variables are the discretization of underlying (latent) bivariate normal continuous variables. The polychoric correlation is an estimate of the Pearson correlation for the underlying latent variables.

10 Comments
Rick,
Interesting thing is PROC FREQ could get CL ,not P value, PROC CORR could get P value, not CL .
Could get both of them under the same PROC ?
I don't know, you'd have to check the doc. The CL can substitute for the p-value for the null hypothesis H0: rho=rho0, where usually we are interested in H0: rho=0. In that case, you construct a CL at the alpha significance level. If 0 is outside of the CL, you can reject the null hypothesis. In that sense, I prefer to see a CL because it is more flexible.
Rick,
I found it . Using TEST statement could get job done.
proc freq data=Agree;
tables Quality * Performance / PLCORR CL norow nocol nopercent;
weight Count;
test plcorr;
run;
Thanks for sharing.
Rick,
I never realized that PROC FREQ could calculated pearson correlation and its CL .
And I compared it with PROC CORR 's pearson correlation CL .
Learn it from your blog:
https://blogs.sas.com/content/iml/2017/09/20/fishers-transformation-correlation.html
proc freq data=sashelp.heart;
tables weight * height / PLCORR CL norow nocol nopercent;
run;
proc corr data=sashelp.heart pearson fisher(biasadj=no);
var weight height;
run;
But get different result. Which CL is the right CL ?
PROC FREQ is [ 0.4948 , 0.5400 ]
PROC CORR is [ 0.497194 , 0.537016 ]
These two procedure estimate different quantities. PROC CORR assumes that the variables are continuous. It estimates the Pearson correlation between the 5,199 pairs of nonmissing (weight,height) values.
PROC FREQ assumes that the variables are ordinal. The height variable has 87 categories. The weight variable has 177 categories. If you assume that these ordinal values are a discretization of latent bivariate normal continuous variables, then PROC FREQ tries to find the correlation between the latent variables.
Regarding the confidence intervals, they are also different. PROC CORR uses the Fisher z-transformation and an assumption of bivariate normality to estimate the standard errors. PROC FREQ uses the Hessian of the log-likelihood function at the optimal parameter values.
As to which is correct, I would use the PROC CORR results because the variables are continuous, not ordinal.
Pingback: Estimate polychoric correlation by maximum likelihood estimation - The DO Loop
It was interesting to learn about this method of correlation, but I think the requirement of a latent bivariate normal distribution is a pretty big limitation. As shown by https://escholarship.org/uc/item/583610fv , this turns out to be the case, and so the method lacks robustness. Why do you like polychoric correlation over Kendall's tau-b?
> Why do you like polychoric correlation over Kendall's tau-b?
I never claimed to "like" polychoric correlation, nor have I suggested that it should be preferred over other competing statistics. In choosing a statistic, a researcher should always ask whether the assumptions of a method are reasonable for their data.
Pingback: Simulate correlated continuous and discrete variables - The DO Loop