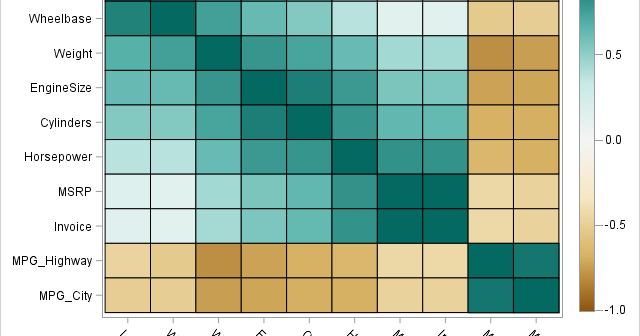
Recently, I was asked whether SAS can perform a principal component analysis (PCA) that is robust to the presence of outliers in the data. A PCA requires a data matrix, an estimate for the center of the data, and an estimate for the variance/covariance of the variables. Classically, these estimates
Tag: Data Analysis
Last week I blogged about the broken-stick problem in probability, which reminded me that the broken-stick model is one of the many techniques that have been proposed for choosing the number of principal components to retain during a principal component analysis. Recall that for a principal component analysis (PCA) of
Skewness is a measure of the asymmetry of a univariate distribution. I have previously shown how to compute the skewness for data distributions in SAS. The previous article computes Pearson's definition of skewness, which is based on the standardized third central moment of the data. Moment-based statistics are sensitive to
An important problem in machine learning is the "classification problem." In this supervised learning problem, you build a statistical model that predicts a set of categorical outcomes (responses) based on a set of input features (explanatory variables). You do this by training the model on data for which the outcomes
A SAS customer asked how to use SAS to conduct a Z test for the equality of two proportions. He was directed to the SAS Usage Note "Testing the equality of two or more proportions from independent samples." The note says to "specify the CHISQ option in the TABLES statement
Suppose you roll six identical six-sided dice. Chance are that you will see at least one repeated number. The probability that you will see six unique numbers is very small: only 6! / 6^6 ≈ 0.015. This example can be generalized. If you draw a random sample with replacement from
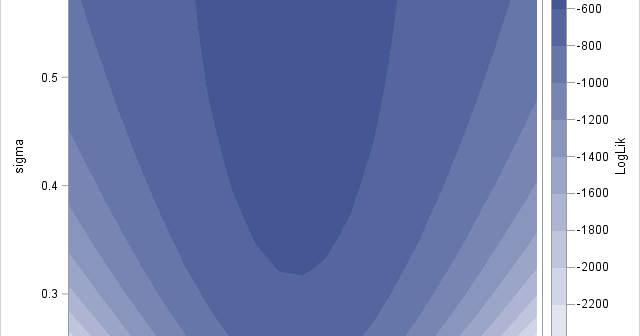
In a previous article, I showed two ways to define a log-likelihood function in SAS. This article shows two ways to compute maximum likelihood estimates (MLEs) in SAS: the nonlinear optimization subroutines in SAS/IML and the NLMIXED procedure in SAS/STAT. To illustrate these methods, I will use the same data
Maximum likelihood estimation (MLE) is a powerful statistical technique that uses optimization techniques to fit parametric models. The technique finds the parameters that are "most likely" to have produced the observed data. SAS provides many tools for nonlinear optimization, so often the hardest part of maximum likelihood is writing down
If you toss a coin 28 times, you would not be surprised to see three heads in a row, such as ...THHHTH.... But what about eight heads in a row? Would a sequence such as THHHHHHHHTH... be a rare event? This question popped into my head last weekend as I
According to Hyndman and Fan ("Sample Quantiles in Statistical Packages," TAS, 1996), there are nine definitions of sample quantiles that commonly appear in statistical software packages. Hyndman and Fan identify three definitions that are based on rounding and six methods that are based on linear interpolation. This blog post shows