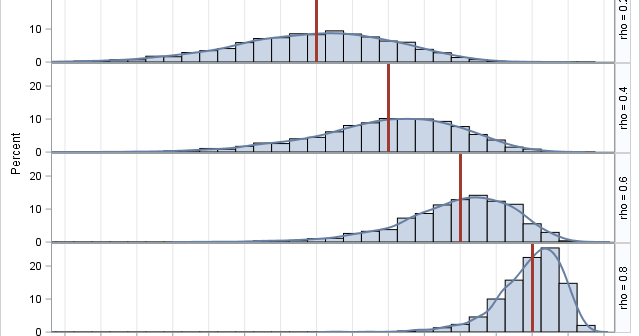
Pearson's correlation measures the linear association between two variables. Because the correlation is bounded between [-1, 1], the sampling distribution for highly correlated variables is highly skewed. Even for bivariate normal data, the skewness makes it challenging to estimate confidence intervals for the correlation, to run one-sample hypothesis tests ("Is

