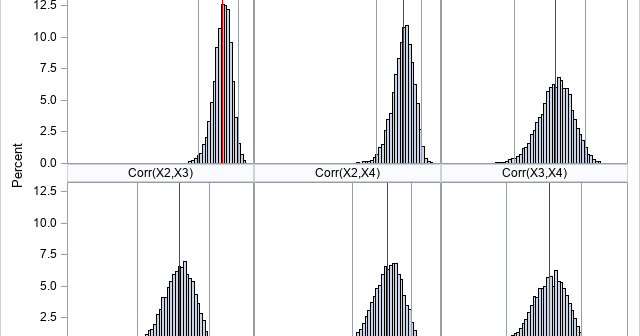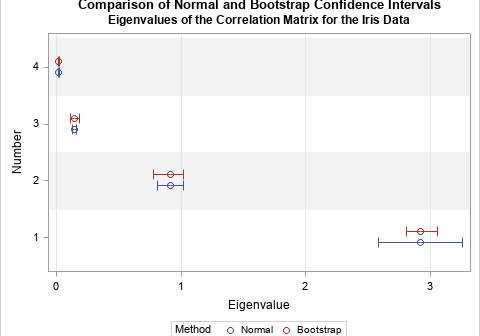
You can use the bootstrap method to estimate confidence intervals. Unlike formulas, which assume that the data are drawn from a specified distribution (usually the normal distribution), the bootstrap method does not assume a distribution for the data. There are many articles about how to use SAS to bootstrap statistics
Tag: Bootstrap and Resampling
For many univariate statistics (mean, median, standard deviation, etc.), the order of the data is unimportant. If you sort univariate data, the mean and standard deviation do not change. However, you cannot sort an individual variable (independently) if you want to preserve its relationship with other variables. This statement is
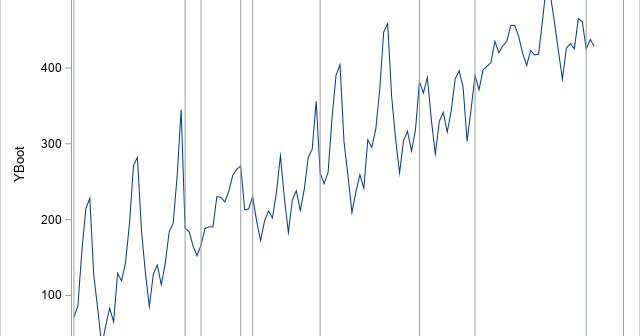
This is the third and last introductory article about how to bootstrap time series in SAS. In the first article, I presented the simple block bootstrap and discussed why bootstrapping a time series is more complicated than for regression models that assume independent errors. Briefly, when you perform residual resampling
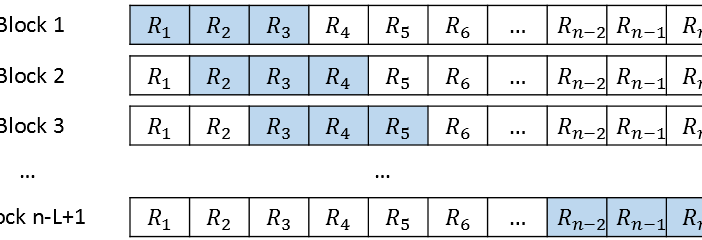
As I discussed in a previous article, the simple block bootstrap is a way to perform a bootstrap analysis on a time series. The first step is to decompose the series into additive components: Y = Predicted + Residuals. You then choose a block length (L) that divides the total
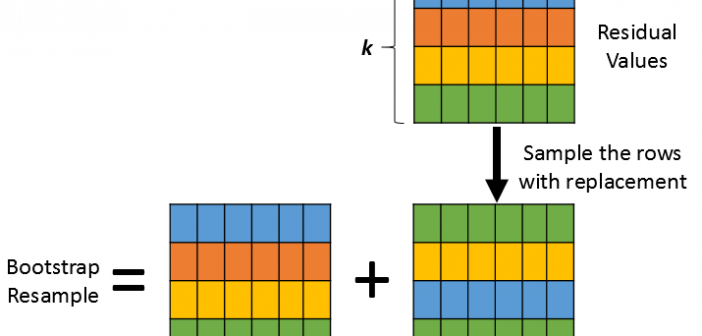
For ordinary least squares (OLS) regression, you can use a basic bootstrap of the residuals (called residual resampling) to perform a bootstrap analysis of the parameter estimates. This is possible because an assumption of OLS regression is that the residuals are independent. Therefore, you can reshuffle the residuals to get
A fundamental principle of data analysis is that a statistic is an estimate of a parameter for the population. A statistic is calculated from a random sample. This leads to uncertainty in the estimate: a different random sample would have produced a different statistic. To quantify the uncertainty, SAS procedures
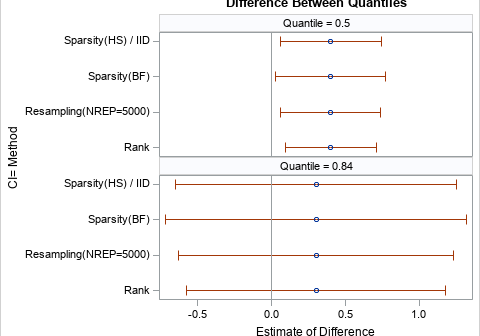
I recently read an article that describes ways to compute confidence intervals for the difference in a percentile between two groups. In Eaton, Moore, and MacKenzie (2019), the authors describe a problem in hydrology. The data are the sizes of pebbles (grains) in rivers at two different sites. The authors
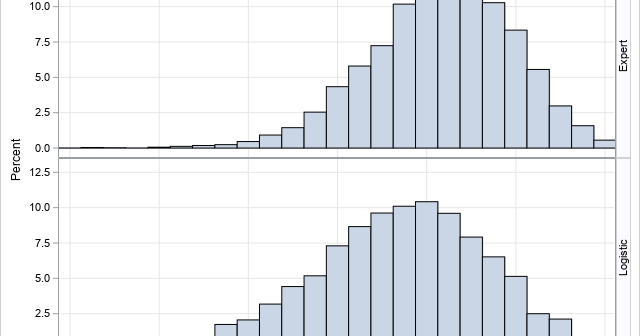
At SAS Global Forum 2019, Daymond Ling presented an interesting discussion of binary classifiers in the financial industry. The discussion is motivated by a practical question: If you deploy a predictive model, how can you assess whether the model is no longer working well and needs to be replaced? Daymond
Many SAS procedures support the BY statement, which enables you to perform an analysis for subgroups of the data set. Although the SAS/IML language does not have a built-in "BY statement," there are various techniques that enable you to perform a BY-group analysis. The two I use most often are
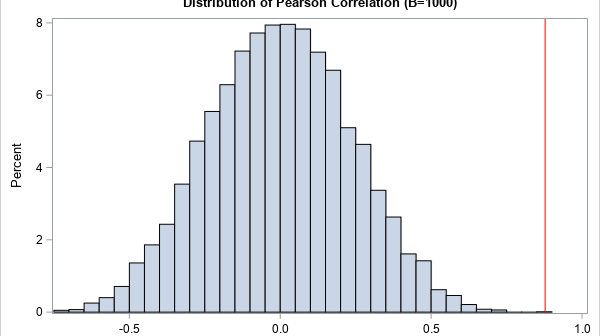
When I run a bootstrap analysis, I create graphs to visualize the distribution of the bootstrap statistics. For example, in my article about how to bootstrap the difference of means in a two-sample t test, I included a histogram of the bootstrap distribution and added reference lines to indicate a