The DO Loop
Statistical programming in SAS with an emphasis on SAS/IML programs
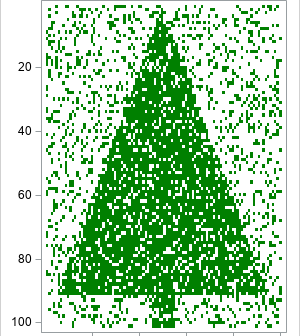
Rockin' around the Christmas tree At the Christmas party hop. – Brenda Lee Last Christmas, I saw a fun blog post that used optimization methods to de-noise an image of a Christmas tree. Although there are specialized algorithms that remove random noise from an image, I am not going to

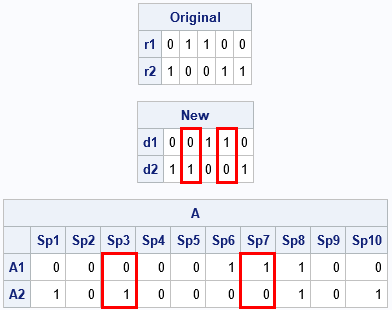
Binary matrices are used for many purposes. I have previously written about how to use binary matrices to visualize missing values in a data matrix. They are also used to indicate the co-occurrence of two events. In ecology, binary matrices are used to indicate which species of an animal are

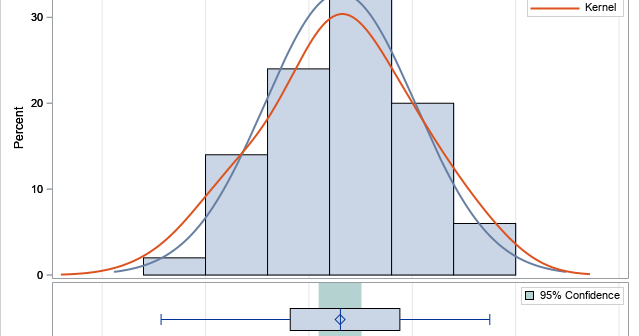
Recently I showed how to visualize and analyze longitudinal data in which subjects are measured at multiple time points. A very common situation is that the data are collected at two time points. For example, in medicine it is very common to measure some quantity (blood pressure, cholesterol, white-blood cell
