The DO Loop
Statistical programming in SAS with an emphasis on SAS/IML programs
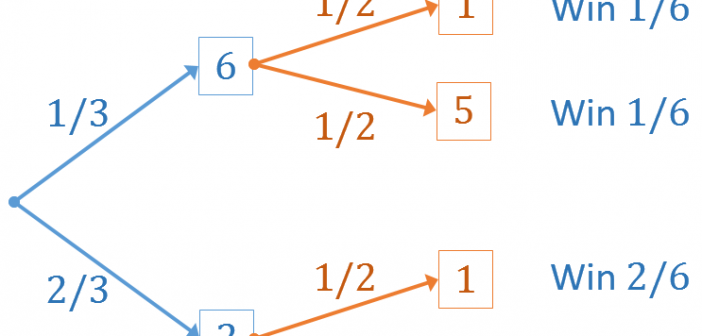
Most games of skill are transitive. If Player A wins against Player B and Player B wins against Player C, then you expect Player A to win against Player C, should they play. Because of this, you can rank the players: A > B > C Interestingly, not all games

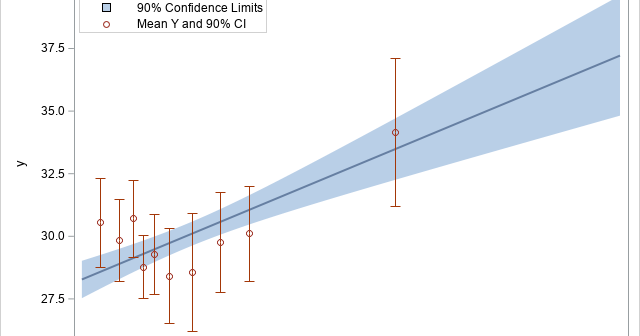
I previously showed how to create a decile calibration plot for a logistic regression model in SAS. A decile calibration plot (or "decile plot," for short) is used in some fields to visualize agreement between the data and a regression model. It can be used to diagnose an incorrectly specified

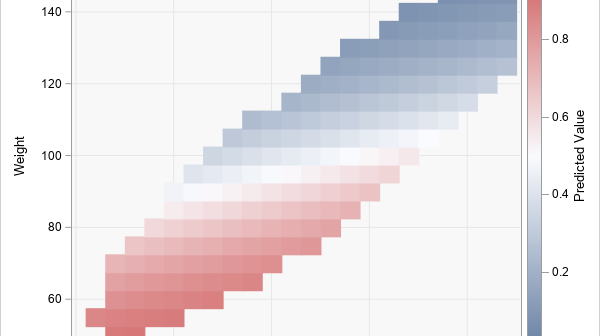
To help visualize regression models, SAS provides the EFFECTPLOT statement in several regression procedures and in PROC PLM, which is a general-purpose procedure for post-fitting analysis of linear models. When scoring and visualizing a model, it is important to use reasonable combinations of the explanatory variables for the visualization. When
