The DO Loop
Statistical programming in SAS with an emphasis on SAS/IML programs
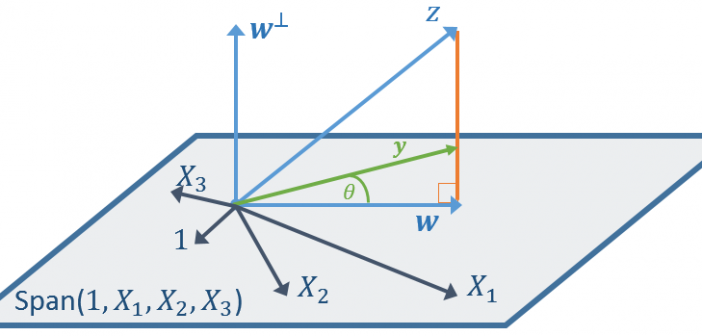
When you perform a linear regression, you can examine the R-square value, which is a goodness-of-fit statistic that indicates how well the response variable can be represented as a linear combination of the explanatory variables. But did you know that you can also go the other direction? Given a set

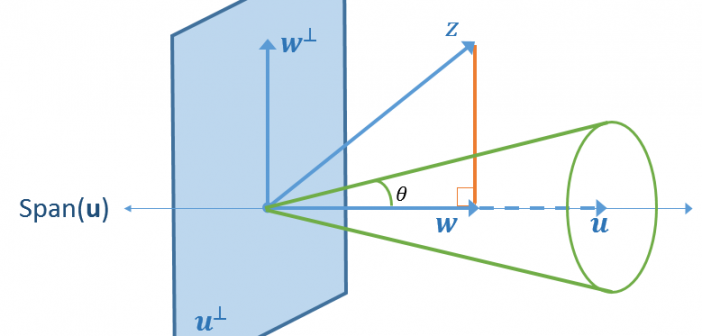
Do you know that you can create a vector that has a specific correlation with another vector? That is, given a vector, x, and a correlation coefficient, ρ, you can find a vector, y, such that corr(x, y) = ρ. The vectors x and y can have an arbitrary number

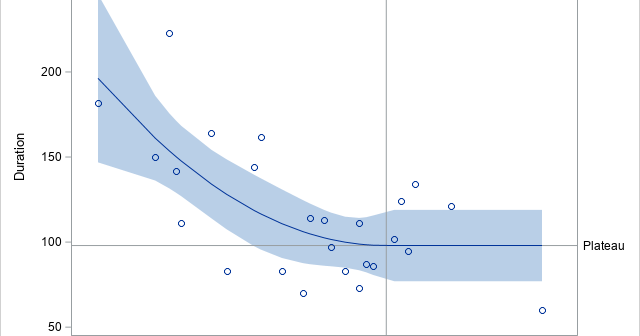
A segmented regression model is a piecewise regression model that has two or more sub-models, each defined on a separate domain for the explanatory variables. For simplicity, assume the model has one continuous explanatory variable, X. The simplest segmented regression model assumes that the response is modeled by one parametric
