Since the financial crisis, banking regulators have started to use stress testing as a way to examine how banks will manage under adverse conditions. The idea is to ensure that banks hold enough capital to survive economic shocks. The European Banking Authority published its draft stress-testing methodology for 2018 back in July 2017. A key part of stress testing is the generation and examination of scenarios, as a way to manage risk.
Evaluation of risk scenario paths
The mapping of possible future situations is a core part of risk management. It requires the calculation of different complex models with possible scenarios, to give a result for each scenario and a prediction time. For multi-period forecasts (for example, for credit portfolios or life insurance), there is one result path per scenario. In the next few paragraphs, I will show how standard functions in SAS can easily help you to evaluate these paths in a variety of scenarios, using visualizations.
Digitalization in banking needs to be performed from end-to-end, encompassing activities in the front-, middle-, and back-office, and underpinned by advanced analytical technologies. Whether you are a business sponsor, data scientist, data manager or IT facilitator, our practitioners have the experience and expertise to help you navigate the analytics path to value. Sign up for our monthly webinars and accelerate your analytics journey.
In the first step we consider all possible paths. This can be managed using percentile bands with the SGPLOT procedure. These presentation routines seem complex at first glance, but they have a lot of very useful customization options.
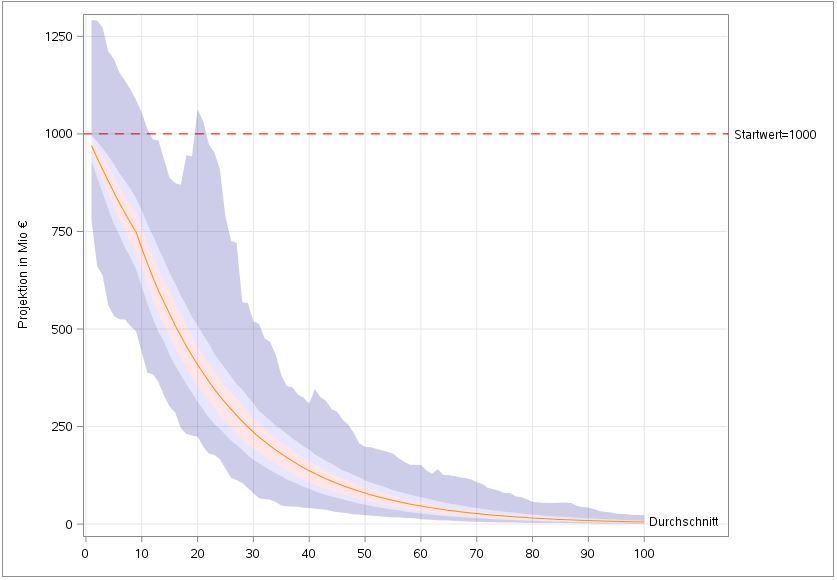
In this illustration you can see the projections for the next 100 years for 1,000 scenarios. The picture shows the average value, minimum, maximum and 10% band, as well as 25%, 90% and 75% percentile band. This form of presentation shows immediately that there are scenarios that deviate significantly from the expected course.
Different percentile values for the variable value are required. These can be determined using the MEANS procedure.
The use of statistical measures gives a good interpretation of the risk in the overall context. For the model validation, we also want to filter out conspicuous scenarios to look at the relevant parameters in more detail. The next figure shows the paths of scenarios in the upper value range.
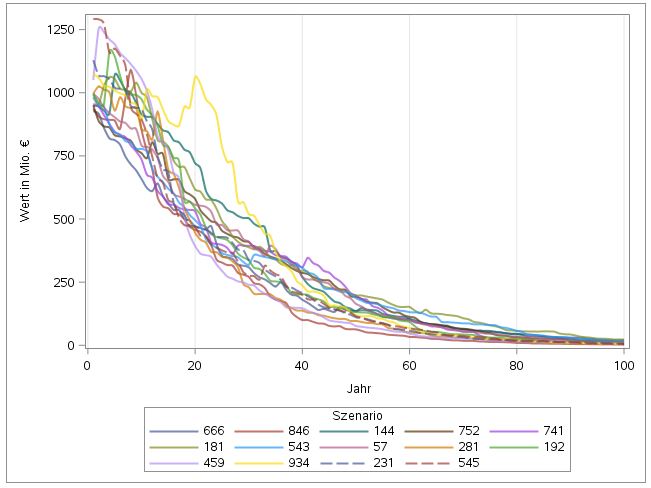
This graphic can also be quickly set up with the SGPLOT procedure. The axes are the variables year and value, and the variable scenario is used for grouping. The graphic representation easily identifies one particularly conspicuous scenario: Number 934.
The SGPLOT procedure details can be found in the product documentation (SAS® 9.4 ODS Graphics: Procedures Guide), which can be found on the http://support.sas.com/ page. The TRANSPARENCY option facilitates actions such as the visual tracking of individual lines. If there are too many paths, the visualization will eventually become confusing. Good visualization therefore depends on careful selection of relevant scenarios.
To select scenarios, I sorted the values by height each year and those that fell into the selection quantile were selected. The INTO: Operator of the SQL procedure generates SAS macro variables to generate parameters for the code.
Risk scenarios are not rocket science
I hope this brief example has shown you that generating and examining risk scenarios is not rocket science. It is not even ‘black box’ science. With suitable visualization tools, it is relatively easy to do, and should give risk managers more confidence in their stress testing.
Generating and examining #risk scenarios is not rocket science. With suitable visualization tools, it is relatively easy to do. Share on XThis blog post was originally published in German on Mehr Wissen.
