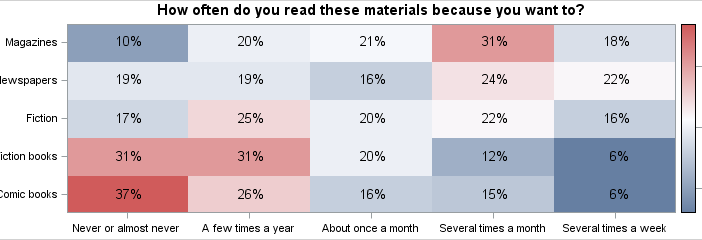
The heatmap is a graphical representation of a table where colors are used to represent the values in the table. This is an effective graphic for finding the minimum and maximum values across the table and may surface patterns in the data. With the addition of the HEATMAPPARM statement to


