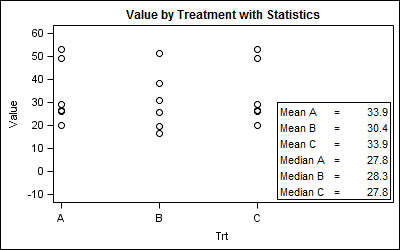
Graphical display of statistics
Statistical graphs often include display of derived statistics along with the raw data. Often these statistics are presented in a tabular format inside the graph. With SGPLOT procedure, a table of statistics can be added to the graph as an inset table, as shown below. Using a Stat Table: SGPLOT code:
