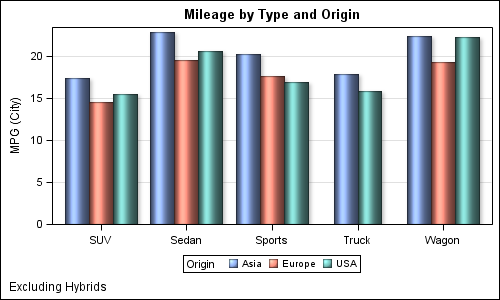
The topic of cluster groups comes up often. By cluster group I am referring to the feature in bar charts where the group values are displayed side by side. With SAS 9.3, SG Procedures support stack or cluster grouping for Bar Charts and overlay or cluster grouping for all other
Tag: Bar Chart
ODS Graphics system was initially motivated by the need for high quality graphs for SAS Base, STAT, and other analytical procedures. Use of SG Procedures, ODS Graphics Designer and GTL by users too has initially focused on analytical graphs. But just like wheels on carryon bags that started for the specific needs of flight
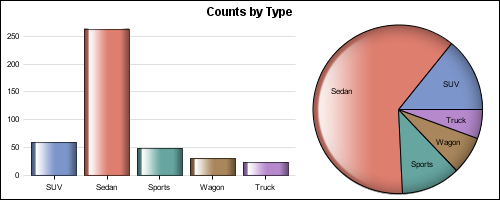
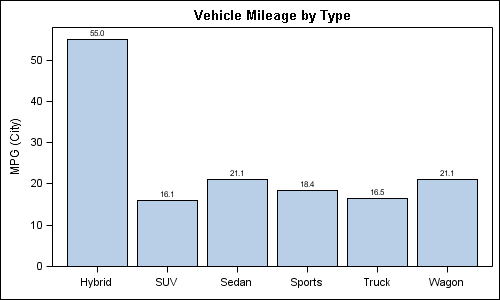
Here are a couple of bar charts showing the city mileage of cars by Type and Origin using the SGPLOT procedure from the sashelp.cars dataset. title 'Vehicle Mileage by Type'; proc sgplot data=cars; format mpg_city 4.1; vbar type / response=mpg_city stat=mean datalabel; xaxis display=(nolabel); run; title 'Counts by Country'; proc sgplot
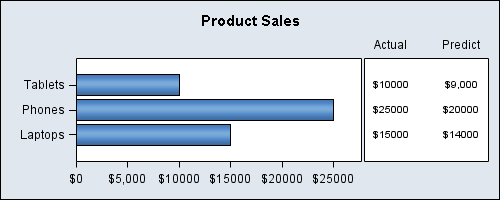
Following up on the theme of graphs commonly used in many applications, here is another one that displays a horizontal bar chart with multiple data columns aligned with the bars. Recently at WUSS, a user stopped by asking how to create just such a graph. While this user wanted something more complex