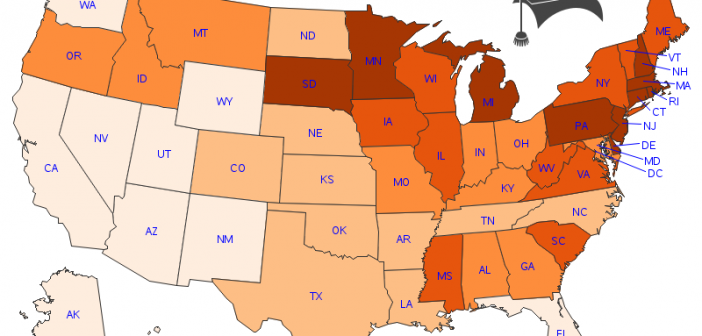
It's that time of year again - the summer is coming to a close, and students are heading to college... And starting the clock ticking on accumulating that student loan debt! Before we get started, here's a little something to set the stage for this topic. This is a picture
English
You have data that you want to visualize. You need to explore your graphing options using SAS, but you don’t know where to start. Help is here with the recently revised Base SAS guide, Introduction to SAS® Platform Graphing. This guide is helpful for novice SAS users as well as
I saw an interesting kangaroo map on reddit, and although the data was deemed "not entirely reliable" it seemed like a fun topic. And also a good exercise to try out the map labeling capabilities in the new Proc SGmap choropleth maps in SAS! For those of you not really
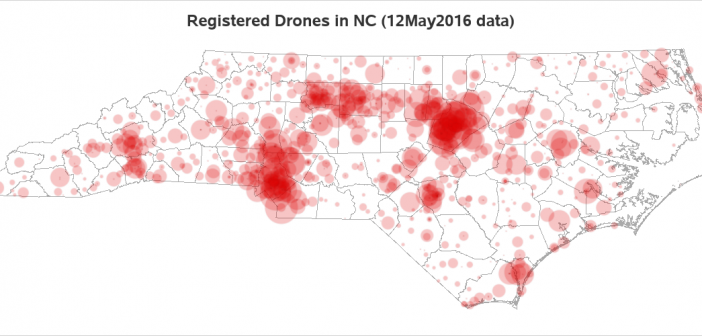
Flying drones was a new & exciting hobby, and very cool fad a few years ago. In recent years, the drone manufacturers have added some really nice features to make the drones easier to fly and more capable ... but the government also added some new rules that have curbed
Have you ever had one of those moments when something you had assumed was true all your life, turned out not to be true? I remember that happening in my high school Spanish class (taught by the wonderful Señor Shoaf), when he let us in on a little secret -
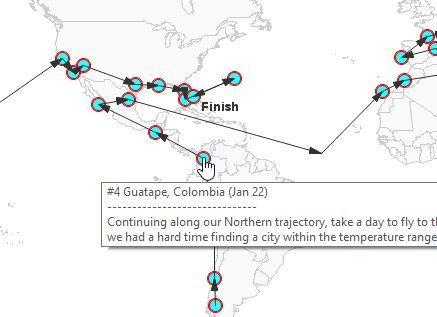
The guys over at reservations.com recently posted a really interesting idea, and a map to go along with it! They worked out an itinerary where you could spend one year traveling around the world (staying in a different place each week), and always be in a comfortable temperature around 70-75°
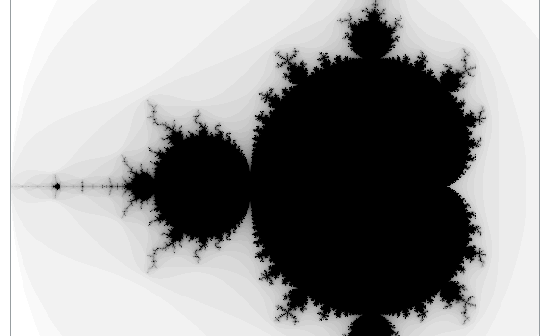
A few years ago Mandelbrot sets and fractals were all the rage! (Am I showing my age? Hahaha!) I thought creating some plots of this type of data would be a good way to sharpen my SAS programming skills, and it would make a nice/interesting example to help teach people
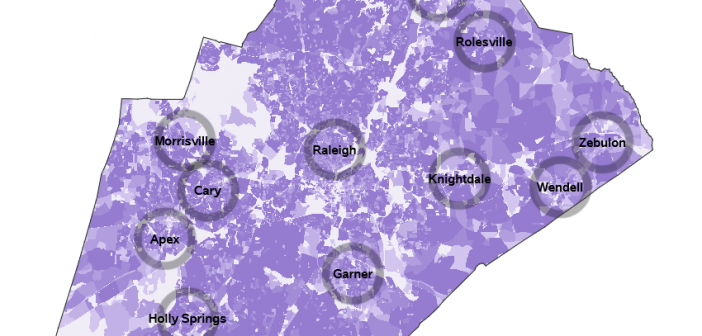
As the 2020 Census approaches, I'm getting my code ready to plot the data! And a question I often hear is "Can you use SAS software to plot data on a Census block map?" Rather than tell you 'yes', let me show you 'yes' 🙂 Preparing the map First I
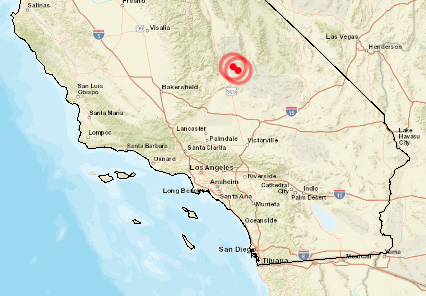
Earthquakes have been in the news lately - in particular, two very strong earthquakes that recently hit California. Exactly where did they hit? ... Let's plot it on a map! But before we get busy analyzing the California data, here's a picture to get you in the mood for studying
We just had the big July 4th holiday weekend here in the US. And as with many holidays, there was a lot of drinking. Which got me thinking/wondering ... which counties do not allow alcohol to be sold (ie, which counties are 'dry')? And it seemed like a question that