Author

Sanjay Matange
RSS
Director, R&D

Sanjay Matange is R&D Director in the Data Visualization Division responsible for the development and support of the ODS Graphics system, including the Graph Template Language (GTL), Statistical Graphics (SG) procedures, ODS Graphics Designer and related software. Sanjay has co-authored a book on SG Procedures with SAS/PRESS.

Data Visualization
Sanjay Matange 1
Getting Started with SGPLOT - Part 4 - Series Plot

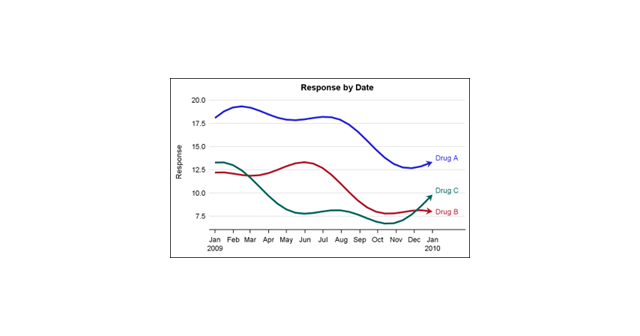
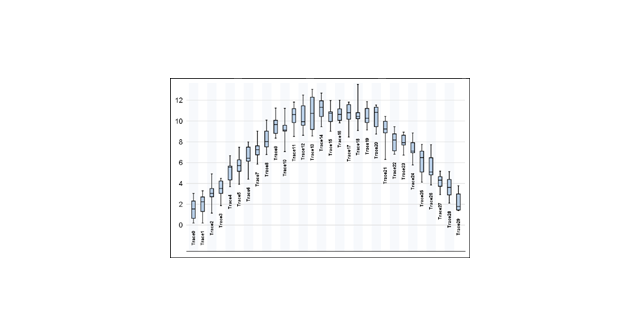
This is the 4th installment of the Getting Started series.  The audience is the user who is new to the SG Procedures.  Experienced users may also find some useful nuggets of information here. Series plots are frequently used to visualize a numeric response on the y-axis by another numeric variable on

Data Visualization
Sanjay Matange 9
Funnel Graphs

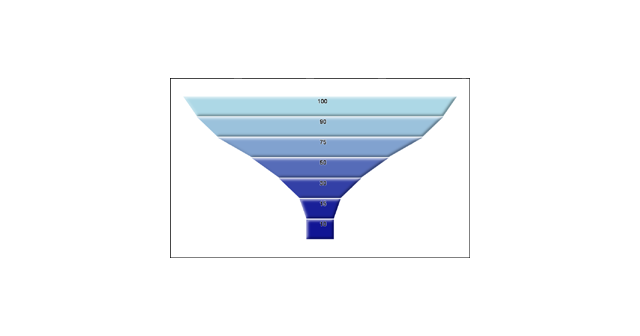
Funnel graphs are useful to track the number of visitors passing through various pages of a website or the number of patients in a study.  The graph shows visually the retention of users or subjects in a study across levels of a marketing cycle or the study. One common representation

Data Visualization
Sanjay Matange 1
Scatter with box

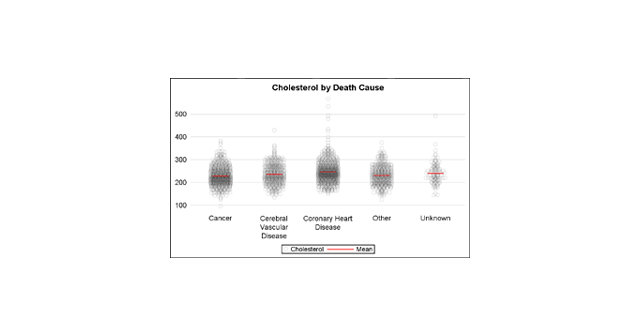
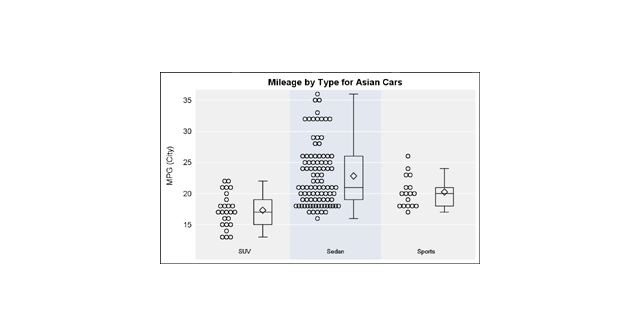
Previously, I discussed ways to create a Box Plot with Stat Table and Markers in the linked article.  One of the graphs showed a Box Plot of Cholesterol by Death cause along with the display of the actual observations.  The main goal for that article was display of statistics with

Data Visualization
Sanjay Matange 9
Hotel Text

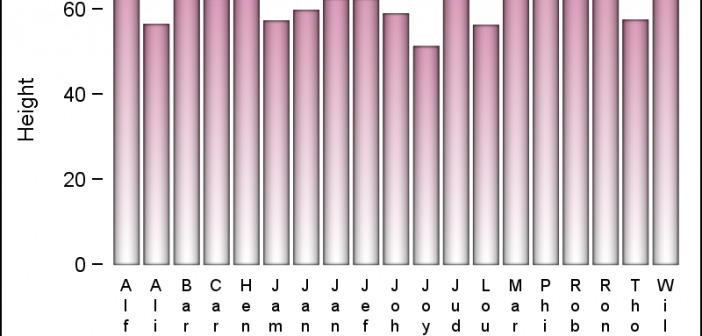
Yesterday, I published an article on Axis values display, where I mentioned the desire expressed by many users to get x-axis tick values in Hotel text orienttion.  The name comes from the way many hotel signs are displayed as shown on the right.  Such arrangement of text can also be very

Data Visualization
Sanjay Matange 8
Axis values display

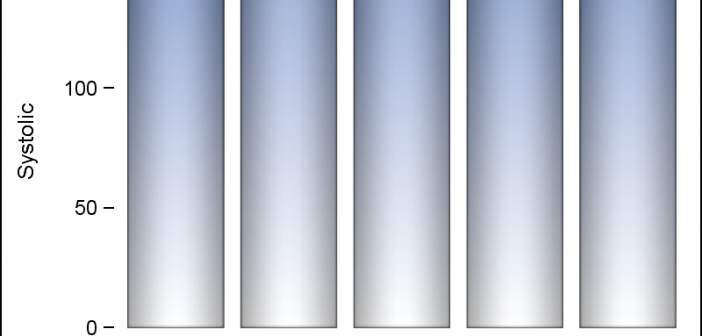
Displaying nicely rendered axis values reduces clutter and makes the graph more readable.  With SAS 9.4, we added the ability for splitting x-axis tick values on white space to create a nice and readable x-axis as shown in the graph on the right. It is always a challenge to fit

1 4 5 6 7 8 30