Everything happens somewhere, and much of our customer data includes location information. Websites include x, y coordinates in semi-structured click streams, and the mobile apps your prospects depend on frequently support device location to provide a personalized, targeted experience.
As my SAS peer Robby Powell said:
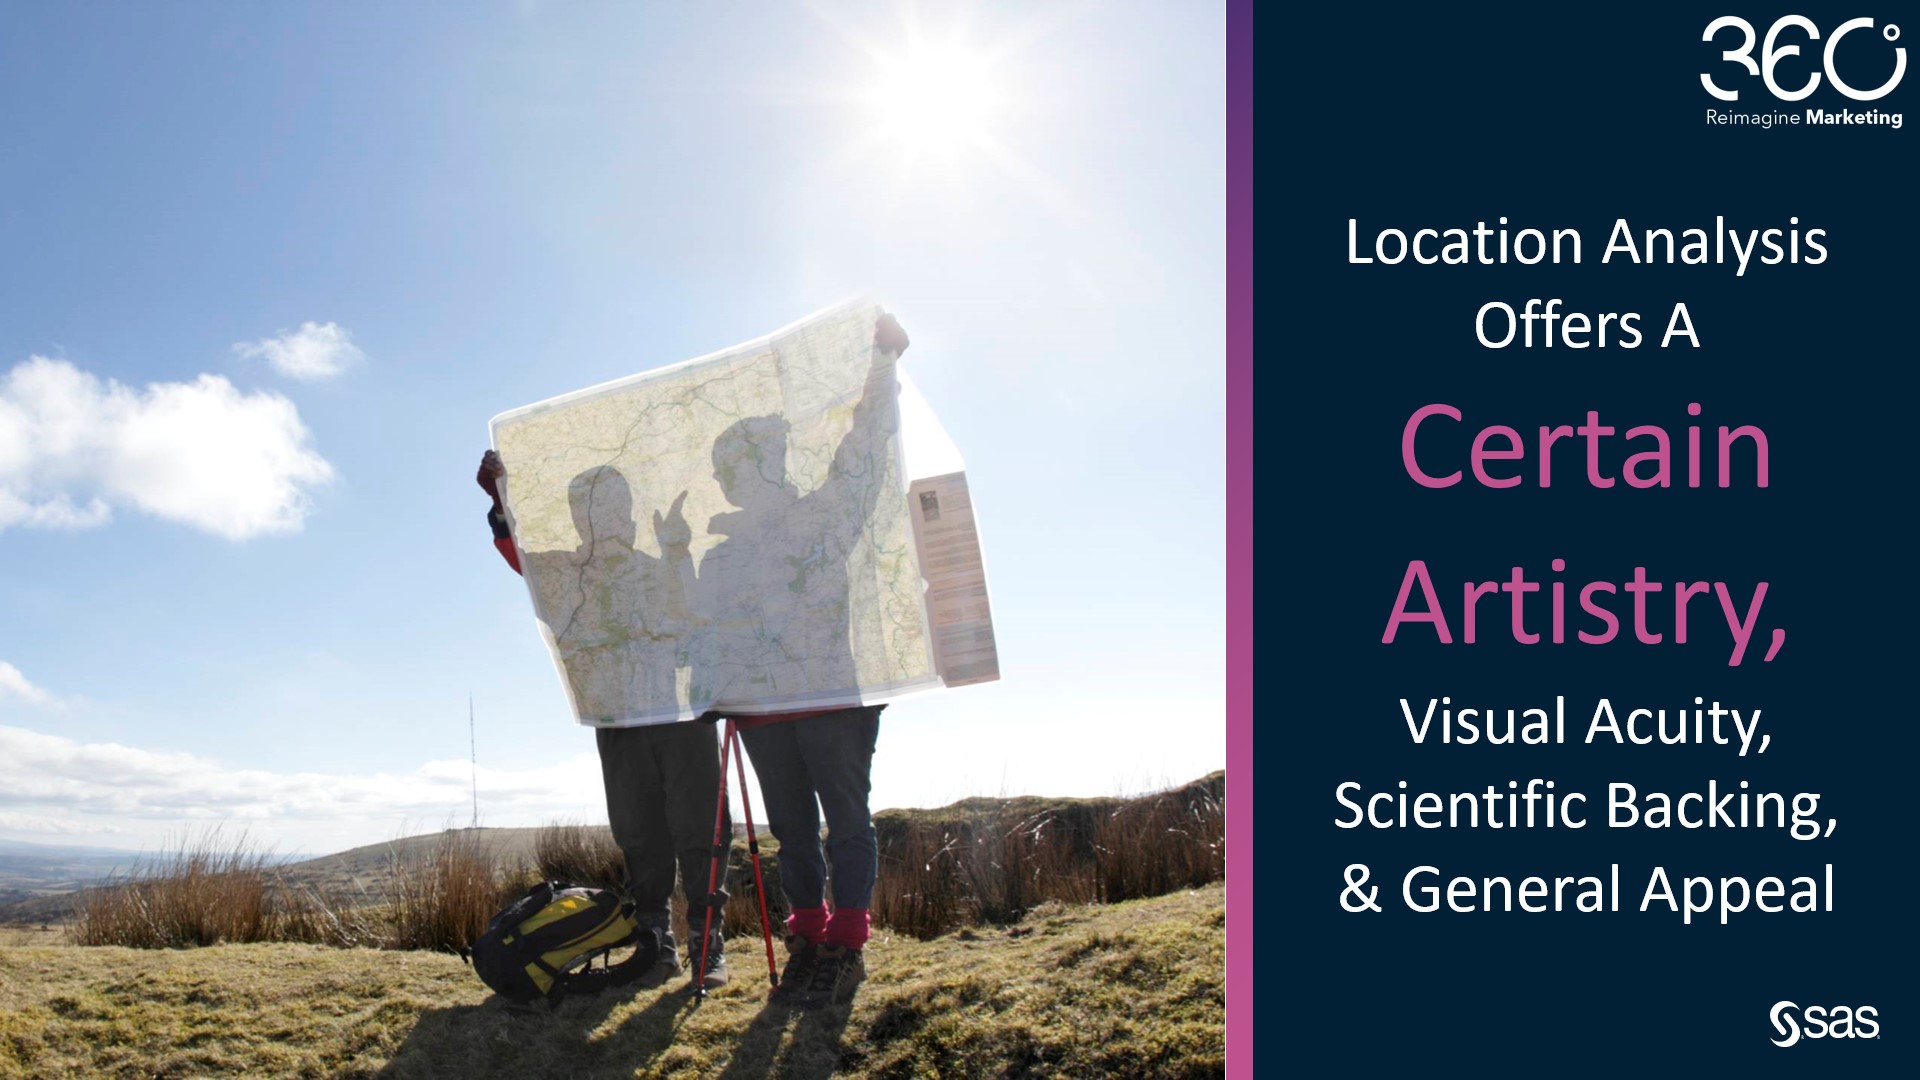
"Human brains are hardwired to build maps. We navigate the world around us through the creation of mental maps, which assemble abstract landmarks and build spatial relationships between them. If you think about how you navigate through your house, even in the dark, it is quite amazing. Maps have been found dating back 25,000 - 30,000 years ago, and the 2014 Nobel Prize for physiology was awarded to scientists who discovered the brain’s GPS system. While lines, bars, and pies are worthy data visualizations, maps offer a certain artistry, visual acuity, scientific backing, and general appeal."

Location analysis is a vital tool that helps in understanding your brand's first-party customer data. SAS Customer Intelligence 360 natively captures consumer behavioral data, which includes a variety of geospatial-specific attributes. SAS Visual Analytics is the front-end analysis tool for SAS Customer Intelligence 360, and allows users to take advantage of a wide variety of geographic analyses and enrichment opportunities available from Esri.
Within the subject of marketing data management, let's walk through a presentation and demonstration together in the video below addressing the following questions:
- How does SAS deliver customer location analysis?
- What data and algorithms does SAS use?
Learn more about how the SAS Platform can be applied for marketing data management and customer use cases.
