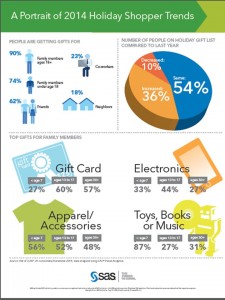
 Everybody cares about the holiday shopping season. For retailers, it can account for as much as 30% of annual sales according to the National Retail Federation ("NRF"). For many individuals, it can be the best time to score great deals on presents for loved ones. For the overall economy, the impact of the holiday shopping season is estimated by the NRF to be $640 Billion, so its importance ripples far beyond the immediate receipts tabulated by retailers.
The start of the holiday shopping season is referred to as "Black Friday" in recognition of many retailers going "into the black" of profitability on the day after Thanksgiving. That important day inspired me to write a Thanksgiving rhyme about a study we conducted on holiday shoppers and their habits throughout the period. And with under a week before Christmas Day, we have less than seven days to appreciate seven things to know about holiday shoppers:
- One in five of us still has gifts to buy. Eighteen percent of holiday shoppers plan to buy gifts this week.
Who are these shoppers? The younger crowd—with an average age of 40 compared to 47 among other shoppers. One-third of those buying this week are under 30. - Those buying this week will spend more. Those of us still shopping for holiday gifts will end up spending an average of $1278 on holiday presents this year, compared to $1077 among those who have literally wrapped up their holiday spending.
- Gift cards will be the “perfect” last minute addition. Gift cards top the shopping list for those still in search of presents this week. Fortunately, they are also the No. 1 request on many wish lists. So pick a card. But not just any card. The most requested gift card brand? Amazon. Also popular: a favorite department store, restaurant or specialty store. Picking the right one adds that personal (and not so last minute) touch. Two in three shoppers will get it right—they ask what people want for the holidays.
- It’s probably too late to ask for electronics. If you’re hoping to sneak in a late request for a new tablet or smartphone, you might have to wait for your birthday. Most of the shopping for electronics was done during Thanksgiving weekend. Black Friday Warriors were out in force snagging the electronics deals.
- Male shoppers will outspend women shoppers. At least that’s what they report in the survey. When men report the holiday spending, the bill comes in at an average of $1,134, compared to $1,077 for women. Men will also spend more on their significant others. But then, men don’t mind spending more for convenience (53% of men agree versus 41% of women).
- More than half of us will have a holiday spending hangover. When the holiday bills start rolling in, 57% will feel like we overspent during the holidays. But men, despite spending more, are less likely to feel the post-holiday guilt (51% versus 63% of women). Go figure.
- Holiday shopping is stressful for four in ten of us. According to our survey, holiday shopping stress is related to the desire to find the “perfect gift,” pressure to stay on budget and maybe even over planning.
 Those who say holiday shopping causes them stress are much more likely than the “non-stressed” to have a holiday budget (62% versus 46%), spend extra time to save money (73% versus 58%) but are more likely to overspend (67% versus 55%). The takeaway: Chillax - it’s Christmas.
Like a stocking stuffed with goodies, there are other useful insights about holiday shoppers in the report, titled Holiday Shopping Styles: November 2014 . The research entailed a survey conducted by SAS in the US just in time for the holiday shopping season.

2 Comments
If Edward Tufte or Stephen Few were dead, they'd be rolling over over in their graves. This (A Portrait of 2014 Holiday Shopping Trends) is probably the worst collection of "Chart Junk" I've ever seen associated with a firm for which I have a great deal of respect. It is hard to believe that this came from the same firm that created the ODS Statistical Graphics Package.
In my Intro Stat class I sometimes ask my students to prowl the web for badly done graphics. This one would win an A+.
If you don't understand what's wrong visit http://www.perceptualedge.com/files/GraphDesignIQ.html.
I also recommend reading Tufte's "Visual Display of Quantitative Information."
Thank you for your comment, Harold. Our blog post infographics are intended to give our readers a quick and engaging overview of the underlying data. We always appreciate feedback.