
Questions on data literacy, part 2

Phil Simon raises two key questions to ask in his second post on data literacy.
Phil Simon raises two key questions to ask in his second post on data literacy.

지난 9월 중순 미국 샌디에고에서 개최된 최대 규모의 분석 컨퍼런스 ‘SAS 애널리틱스 익스피리언스(Analytics Experience) 2018'의 연사로 참여한 빅데이터 전문가 트리샤 왕(Tricia Wang) 박사는 세계적인 동물행동학자 프란스 드 발(Frans de Waal)의 영상을 공유했습니다. 이 영상은 연구자에게 돌을 주고 보상을 받는 두 마리의 원숭이를 통해 인간의 도덕적 심리를 보여주는데요. 원숭이들은 돌을 건네줄
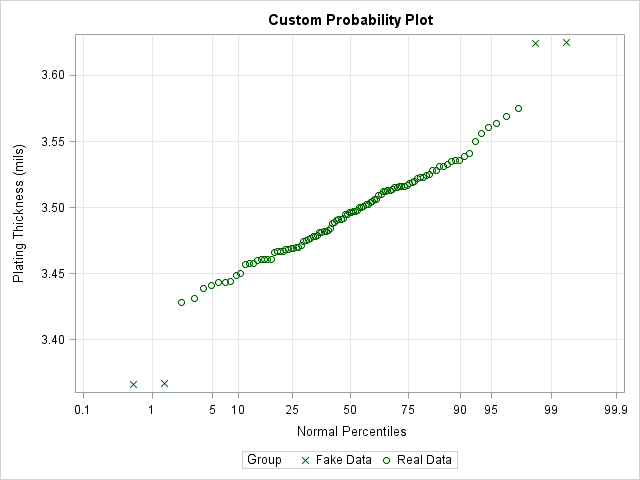
Many data analysts use a quantile-quantile plot (Q-Q plot) to graphically assess whether data can be modeled by a probability distribution such as the normal, lognormal, or gamma distribution. You can use the QQPLOT statement in PROC UNIVARIATE to create a Q-Q plot for about a dozen common distributions. However,

