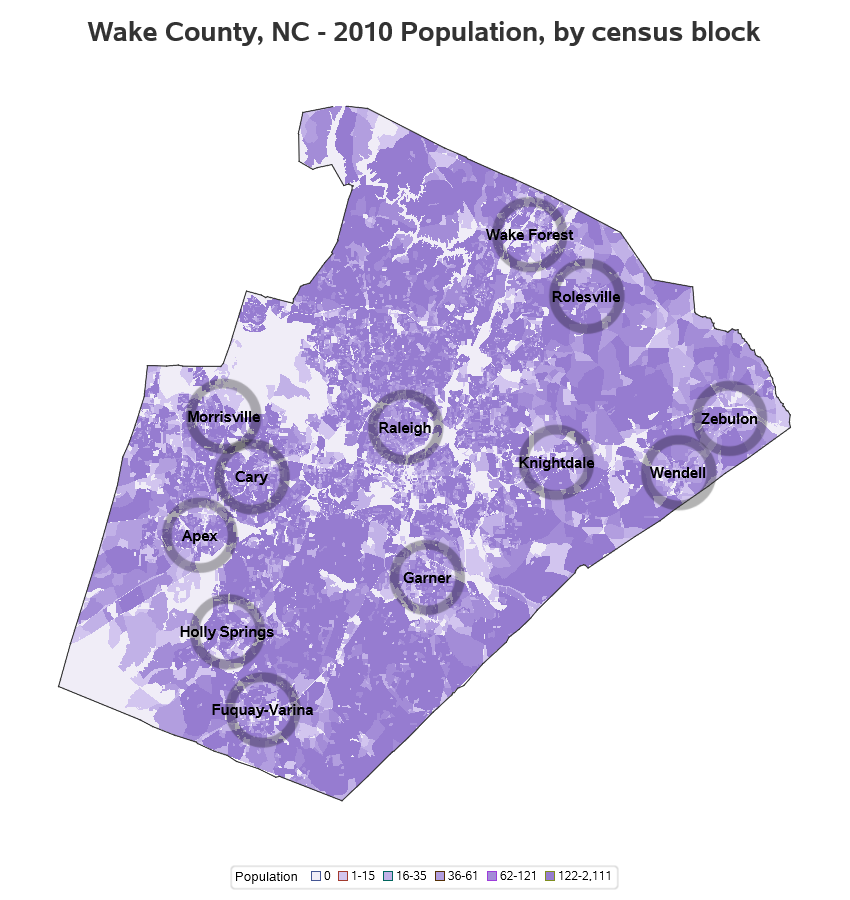
As the 2020 Census approaches, I'm getting my code ready to plot the data! And a question I often hear is "Can you use SAS software to plot data on a Census block map?" Rather than tell you 'yes', let me show you 'yes' :) Preparing the map First I

More and more business applications, including advanced analytics, are moving into the cloud. The advantages are obvious: agility, innovation and cost-efficient high performance. However, many cloud migrations fail to unlock its full potential. To maximize the performance and value of analytics in the cloud, companies need to balance options and
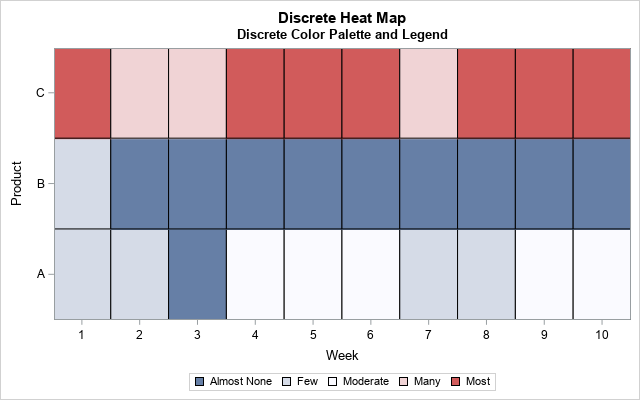
Heat maps have many uses. You can use a heat map to visualize correlation matrices, to visualize longitudinal data ("lasagna plots"), and to visualize counts in any two-dimensional table. As of SAS 9.4m3, you can create heat maps in SAS by using the HEATMAP and HEATMAPPARM statements in PROC SGPLOT.