Uncovering the hidden parts of the SAS log

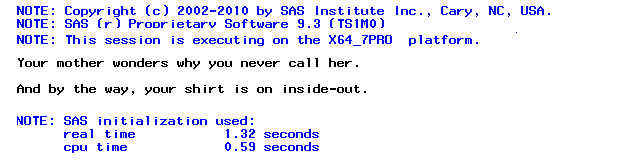
Before there was CNN or FOX News, people used to get their news from SAS. At least, that's how I imagine that people kept themselves informed. What else can explain the existence of the NEWS= system option, which helps SAS admins to surface the must-know information to the SAS community?