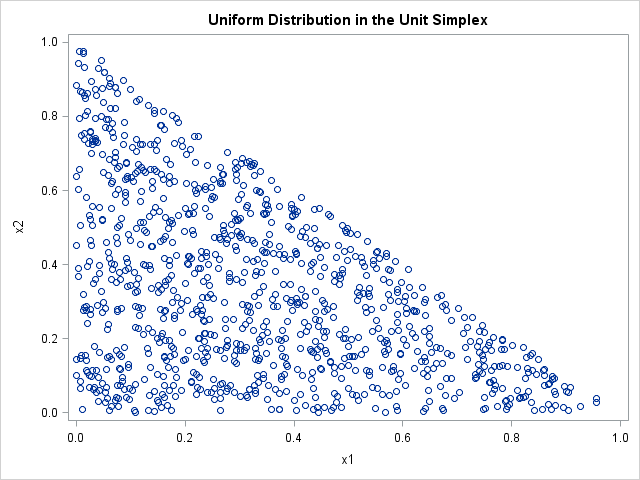
It is easy to simulate data that is uniformly distributed in the unit cube for any dimension. However, it is less obvious how to generate data in the unit simplex. The simplex is the set of points (x1,x2,...,xd) such that Σi xi = 1 and 0 ≤ xi ≤ 1
A year ago I set out to periodically blog from my perspective of leading R&D for our advanced analytics software. I invited SAS colleagues who also work in various areas of advanced analytics to blog on their own interesting conversations with each other and with customers about the intersection of
SAS/GRAPH gives you the ability to customize your graphs (or even create totally new types of custom graphs) ... and it is my firm belief that it gives you a competitive advantage by allowing you to "make sense" of your data in ways your competitors can't. Most of the examples in