Uncategorized

Rick Wicklin 0
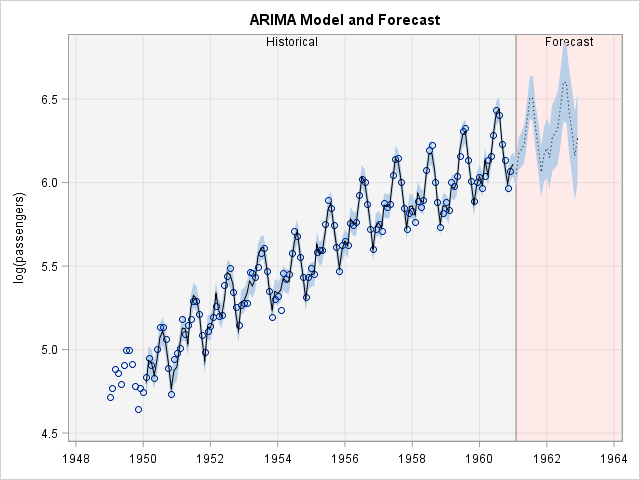
Highlight forecast regions in graphs

A SAS customer asked how to use background colors and a dashed line to emphasize the forecast region for a graph that shows a time series model. The task requires the following steps: Use the ATTRPRIORITY=NONE option on the ODS GRAPHICS statement to make sure that the current ODS style

Analytics
Juan Montero 0
How do you feel about analytics?

People say that the world has changed, but I think it'd be more accurate to say that people that have changed the world. Social media, big data, big analytics, internet of things … whether you're an executive, a data scientist, or a student, when you hear these buzzwords, you have