Uncategorized

Data Visualization
Georgia Mariani 0
University of Idaho replaces legacy BI system with SAS Visual Analytics

When a busy university analytics team is tasked with creating a new, interactive way to share data with dozens of different constituents, data visualization from SAS is the obvious answer. The University of Idaho’s office of Institutional Effectiveness and Accreditation is the source for comprehensive information, analyses and university statistics.

Learn SAS | Programming Tips
Rick Wicklin 0
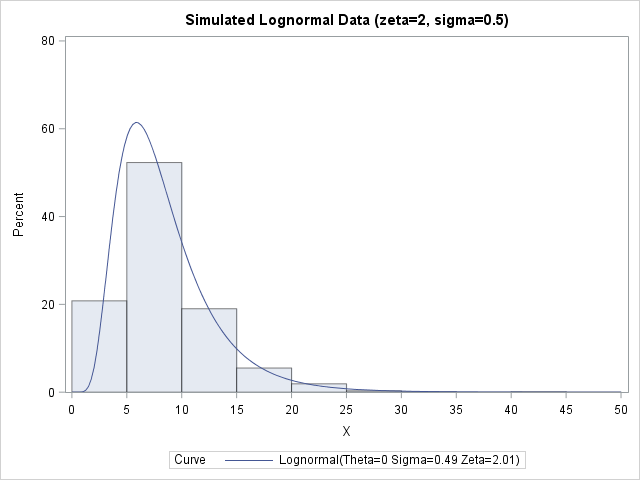
Simulate lognormal data in SAS

A SAS customer asked how to simulate data from a three-parameter lognormal distribution as specified in the PROC UNIVARIATE documentation. In particular, he wanted to incorporate a threshold parameter into the simulation. Simulating lognormal data is easy if you remember an important fact: if X is lognormally distributed, then Y=log(X)