Feature du jour

Feature du jour

Data Visualization
Sanjay Matange 0
Fun with Bar Charts

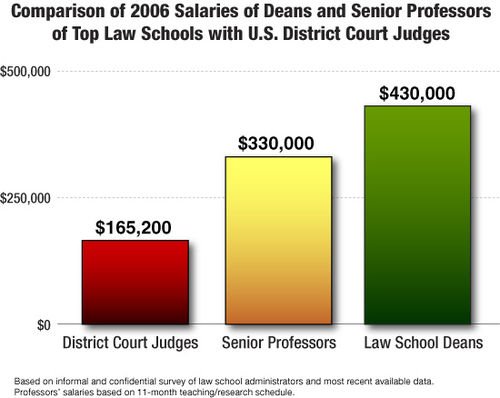
As Sheldon Cooper would say, this is the first episode of "Fun with Charts".  I did not find a cool term like "Vexillology" and "Cartography" is taken by map making, so let us go with "Chartology". Yesterday, I saw a couple of interesting bar charts as shown on the right.  I thought

Data Visualization
Sanjay Matange 0
Clinical Graphs

This week I had the opportunity to present a 1/2 day seminar on creating clinical graphs using the SG procedures during an In-House SAS Users' group meeting.  I have presented this seminar quite a few times now, and I always learn something. The audience was very receptive, with some people

1 38 39 40 41 42 79

Back to Top