Feature du jour
Dual Axis Graph with Zero Equalization

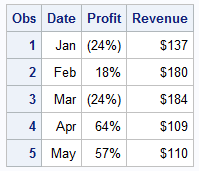
An interesting question came up recently, where a colleague wanted to create a bar line chart with Revenue on the Y axis and Profit on the Y2 axis. The Revenues were all positive, but the Profit had positive and negative values. Some data I generated is shown on the right. Creating this