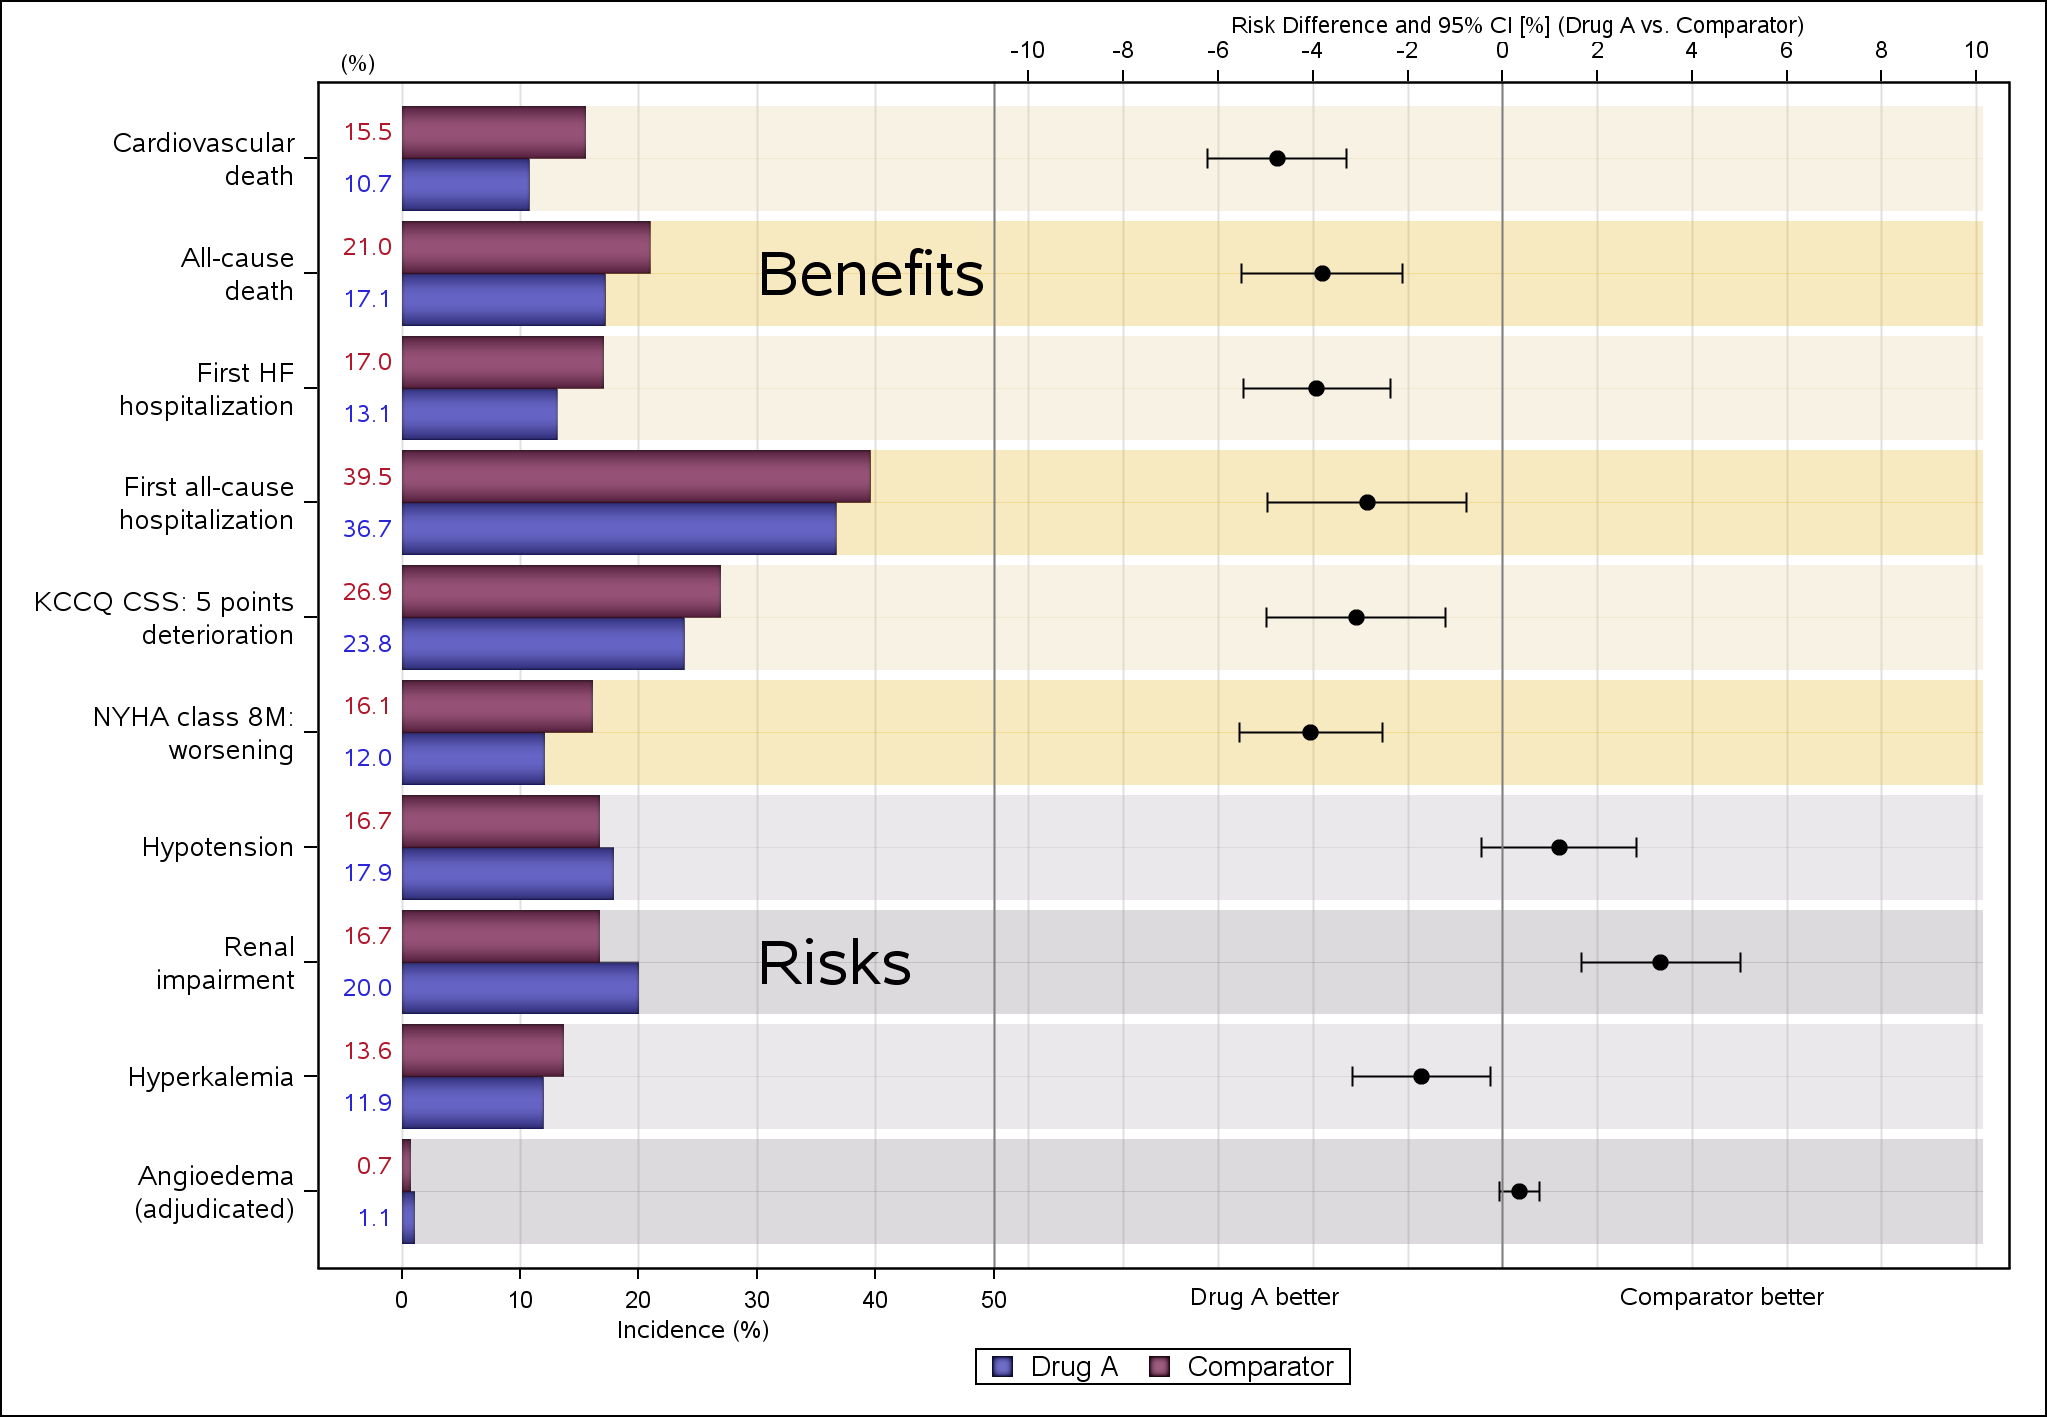
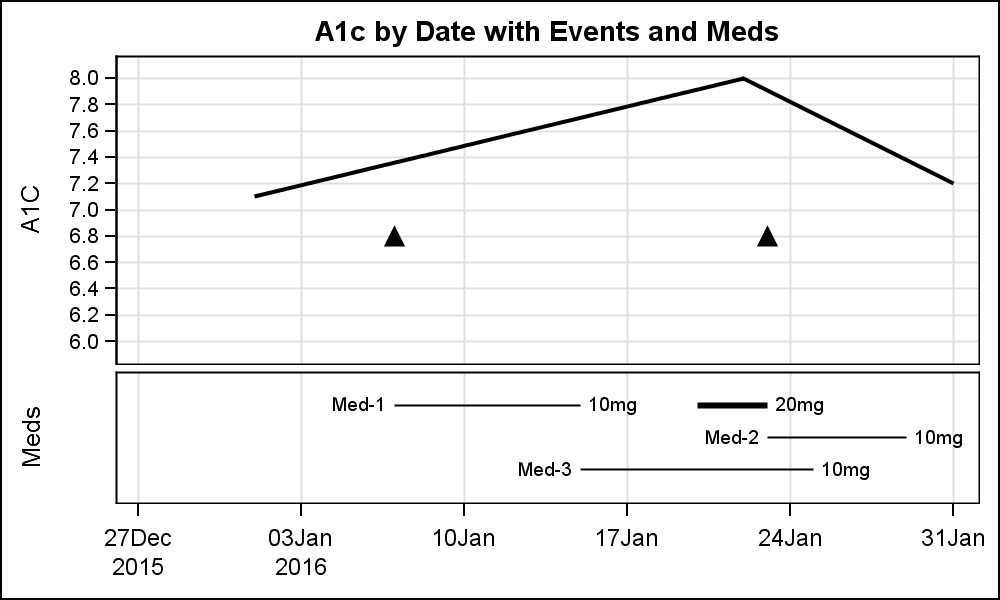
Feature du jour

Feature du jour

Data Visualization
Sanjay Matange 0
Clinical Graphs: A1c Plot

Last week I was visiting San Diego for the SANDS conference.  I always enjoy this conference as I get to interact closely with the users to hear of their pains and innovative solutions to creating Clinical Graphs. In the conference Ed Barber asked about displaying A1c data along with some

Data Visualization
Sanjay Matange 0
Likert Graph Revisited

A few weeks back I posted an article on ways to create a WindRose Graph using SGPLOT procedure.  The process is relatively simple.  Create (R, Theta) data with both numeric axes where the Theta is a value in the data range is 0-360, and R is the corresponding response value.  Then

1 19 20 21 22 23 79

Back to Top